How do I open my browser console?
When working with Pipedrive support, you may be asked for screenshots of your browser console and network information for troubleshooting. Here’s how you can retrieve the correct information to facilitate this process.
Browser console information
The browser console provides information on webpage errors that may not have been seen on the Pipedrive end.
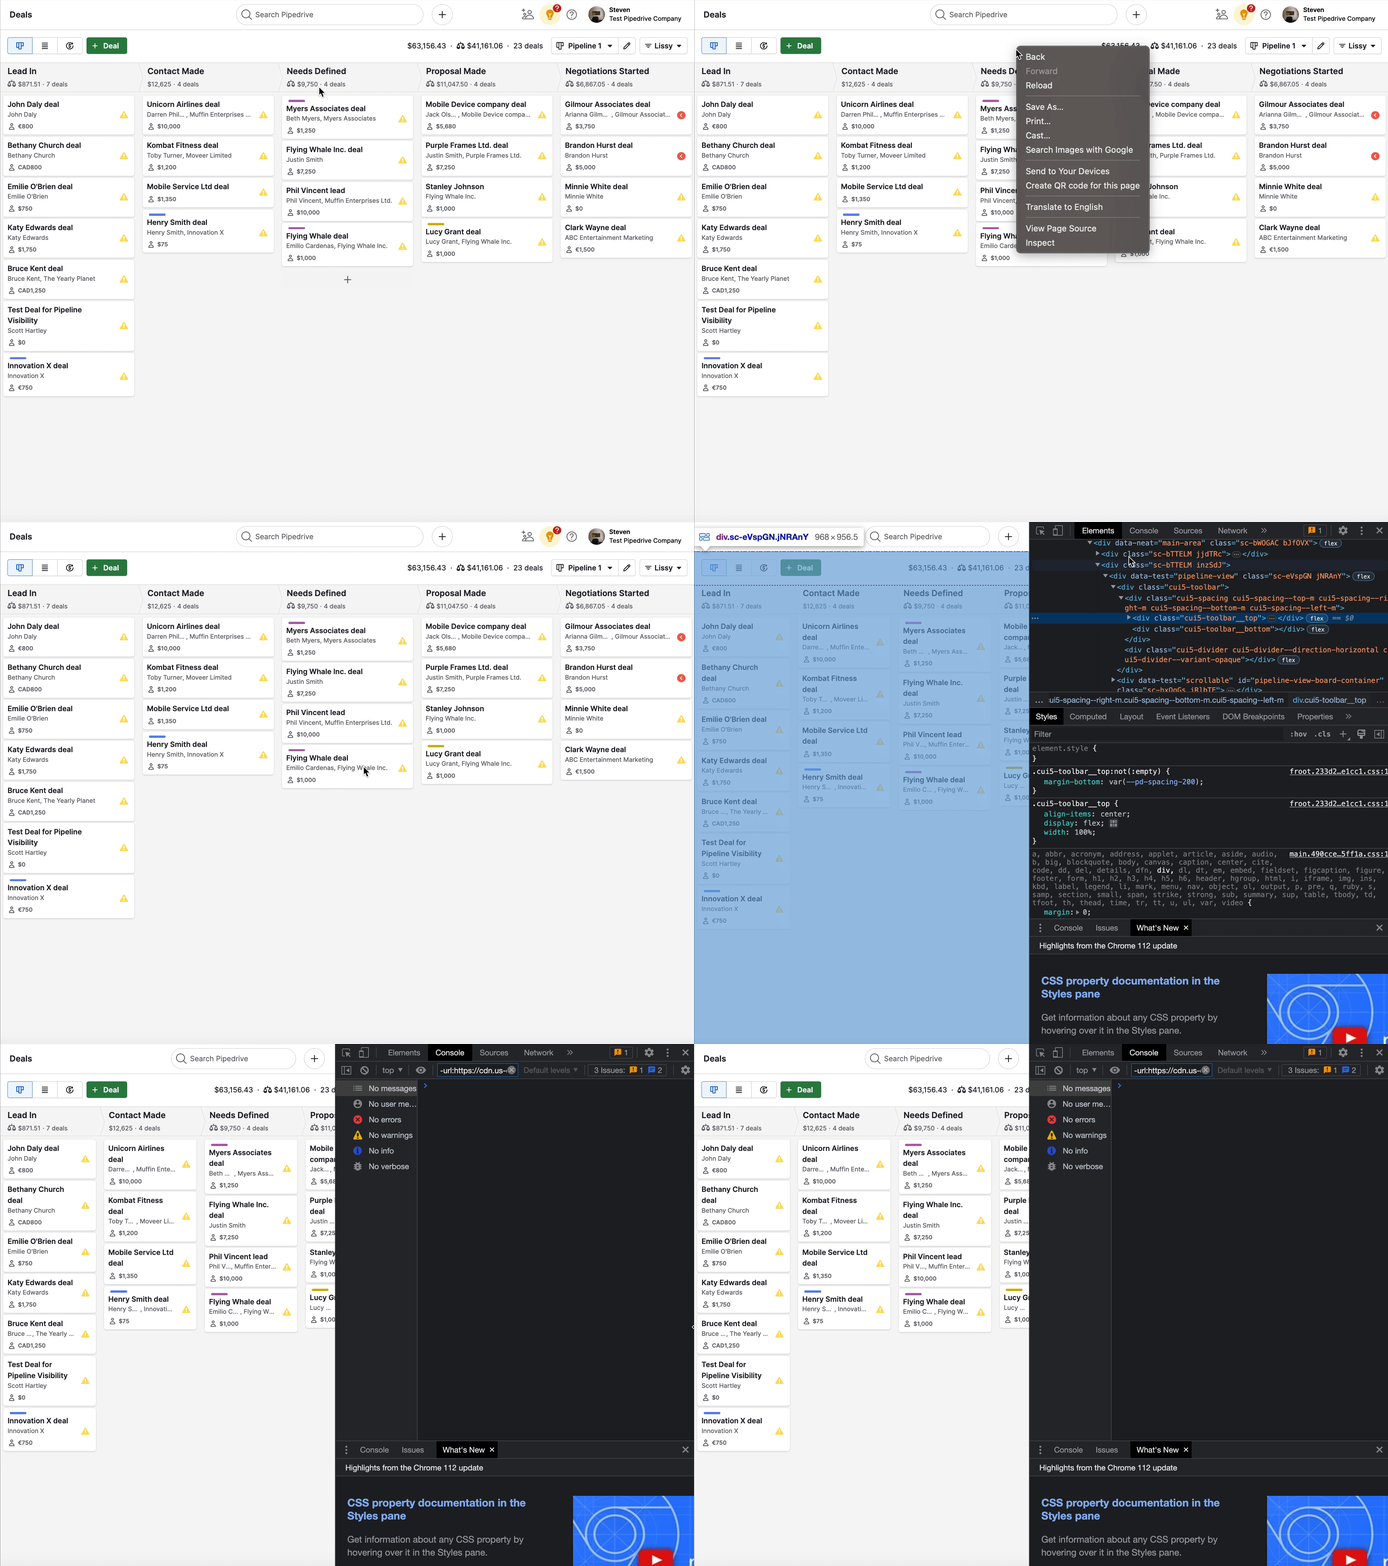
To open the browser console on most browsers, you can:
- Right-click your mouse
- Click “Inspect/Inspect Element”
- Click “Console”
If there are page errors, they’ll appear in red and should be included in any screenshots you provide for the support team. Pipedrive doesn’t provide source maps (console warnings in yellow), so please hide them.
For additional information on how to open your browser console, check out this link.

Browser network information
Browser network information highlights any internet connection issues causing errors.
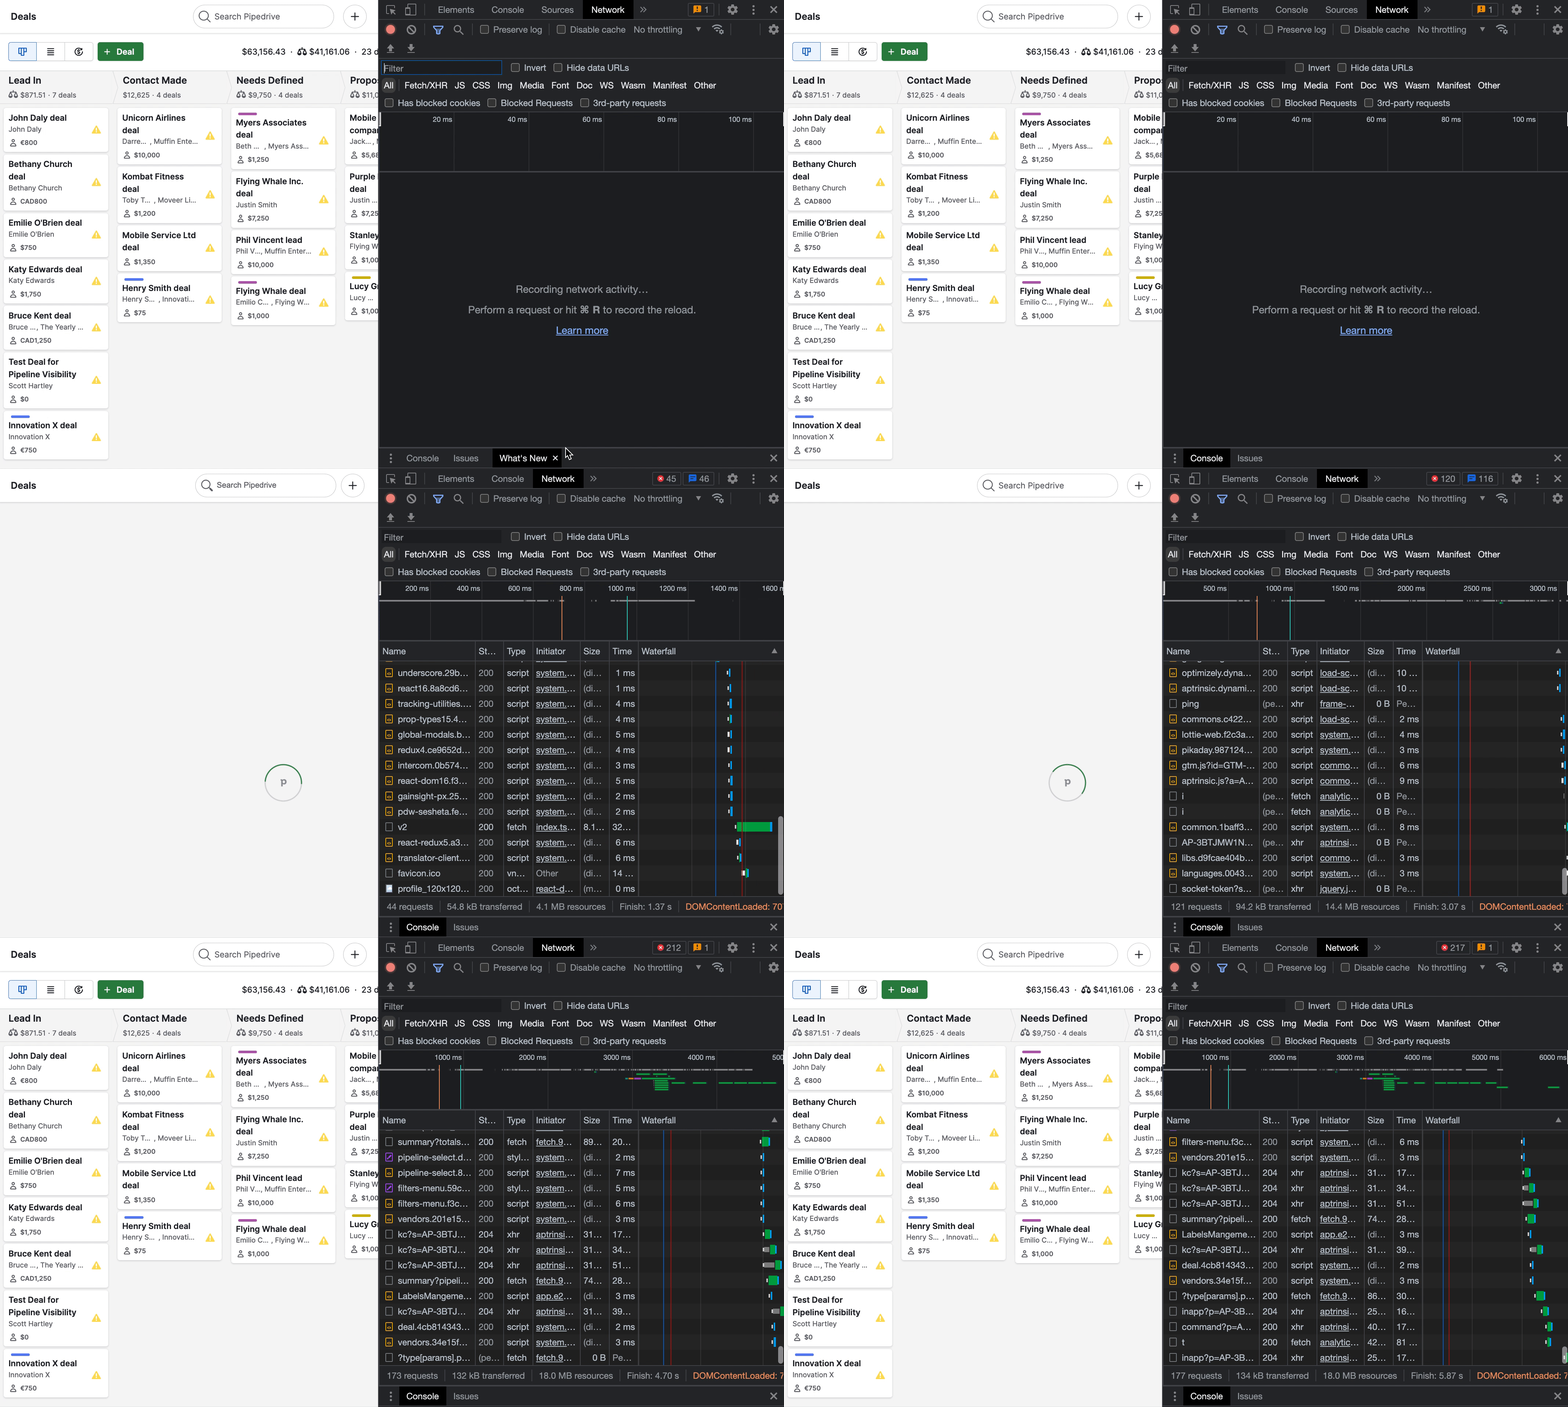
To open your network tab on most browsers, you can:
- Right-click your mouse
- Click “Inspect/Inspect Element”
- Click “Network”
After switching to the Network tab, reload the page to record the activity in the network log before taking the screenshot.

When taking a screenshot of the browser network tab, please capture any errors that appear.
Was this article helpful?
Yes
No