AI report generation in Insights
Creating reports in Insights just got easier. Whether you’re unsure which report type to choose, how to apply filters or where to start, Pipedrive’s AI report generation will guide you through the process, helping you set up reports quickly and effortlessly.
This update makes it easier to start with Insights and provides AI-powered assistance for creating reports faster.
Generate a report with AI
You’ll have two ways to start AI-powered report creation:
From the “Create” button
From a new button in the dashboard view
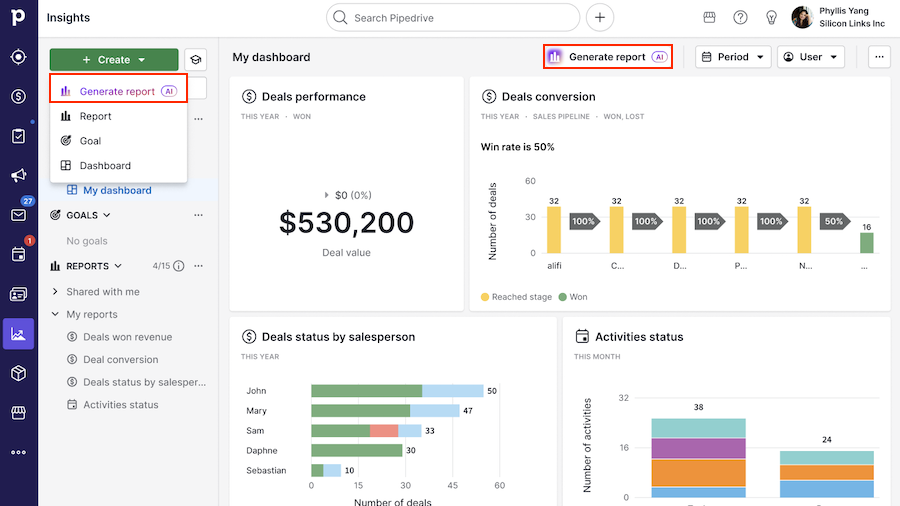
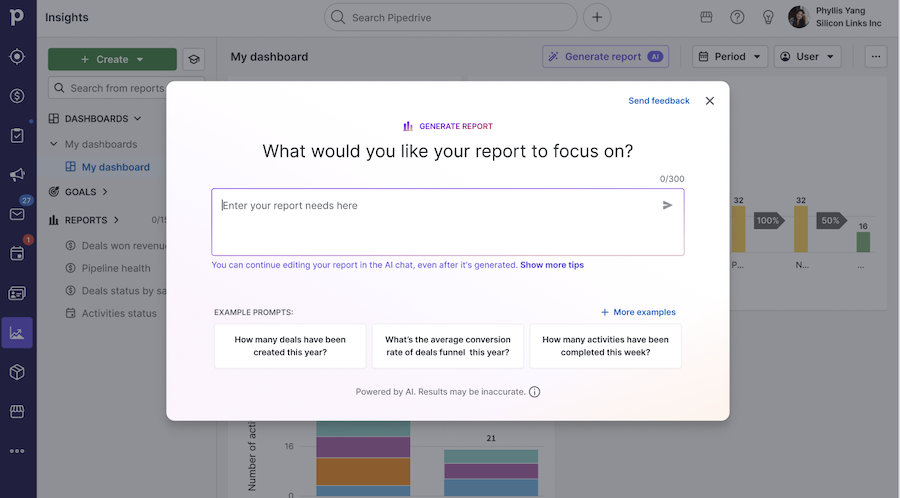
Once you click the “AI report creation” button, a modal will open where you can enter your own prompt or select one of the suggestions.
The Insights AI will generate a report based on your input. On the left-hand side of the screen, you’ll see the chat with the AI bot, including your prompts and other information.
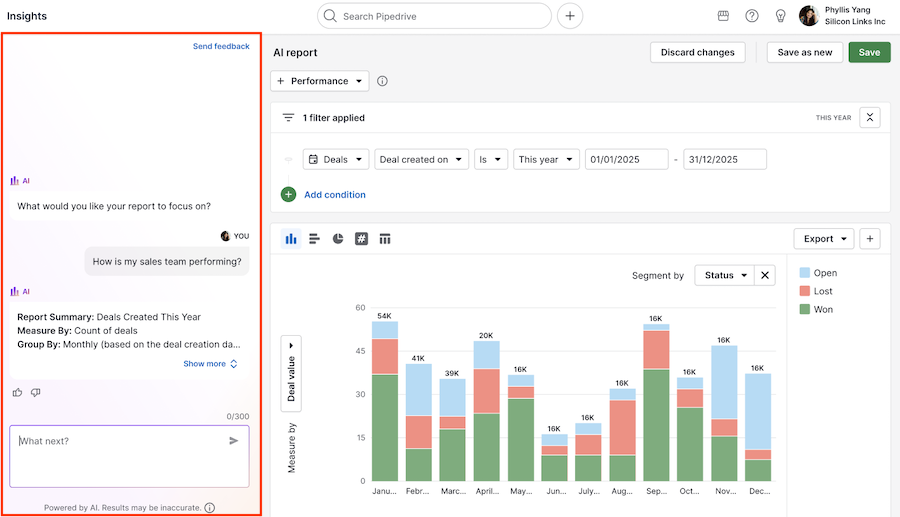
If the report can’t be created, you’ll receive a follow-up question or an explanation of why it wasn’t possible.
You can complete the process by:
Editing filters manually – this will close the AI chat
Saving the report
Canceling report generation
AI report generation FAQ
Which field types are supported?
AI report creation supports the same data fields as manual reports, including custom fields on Premium and higher plans.
Can the AI report generation feature generate dashboards and goals?
AI report generation creates only reports. It doesn’t generate dashboards or goals
Can I edit the filters from an AI report?
Yes, you can.
Can I create several reports with AI at the same time?
Currently, it’s not possible to create two reports at once or generate reports with non-existent data, such as projects.
Can I generate charts with AI?
AI can’t generate pie charts, bar charts, tables or scorecards, but you can manually add these after creating the report.
Was this article helpful?
Yes
No