Campaigns Insights
If you use Campaigns, chances are you’d like to know how effective each campaign has been.
But that can mean a lot of things: the number of opens and clicks, the total number of emails sent, or even filtering to see which campaigns are generating the most engagement.
With Insights for Campaigns, you can track all of that and more!

Where to find it
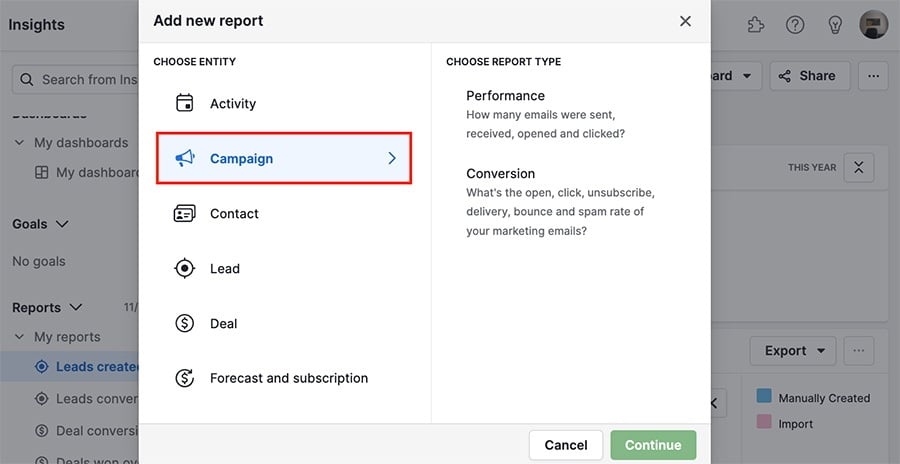
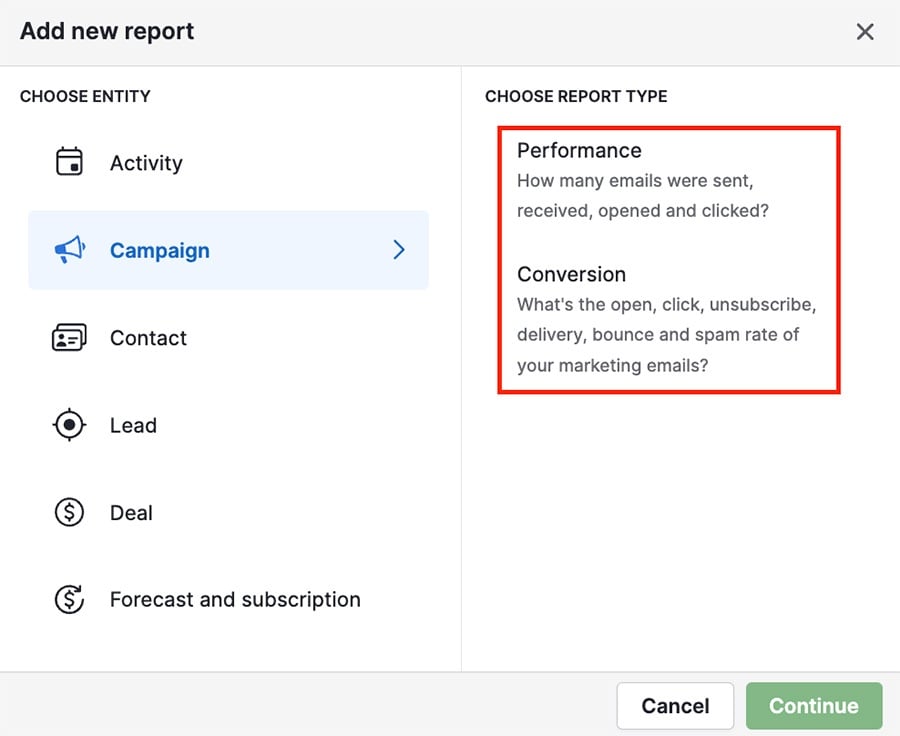
Go to your Insights, select ”+“ > Report > Campaign and choose between either of the available options.
Report types
Campaigns Insights offers two report types: Performance and Conversion.
Performance
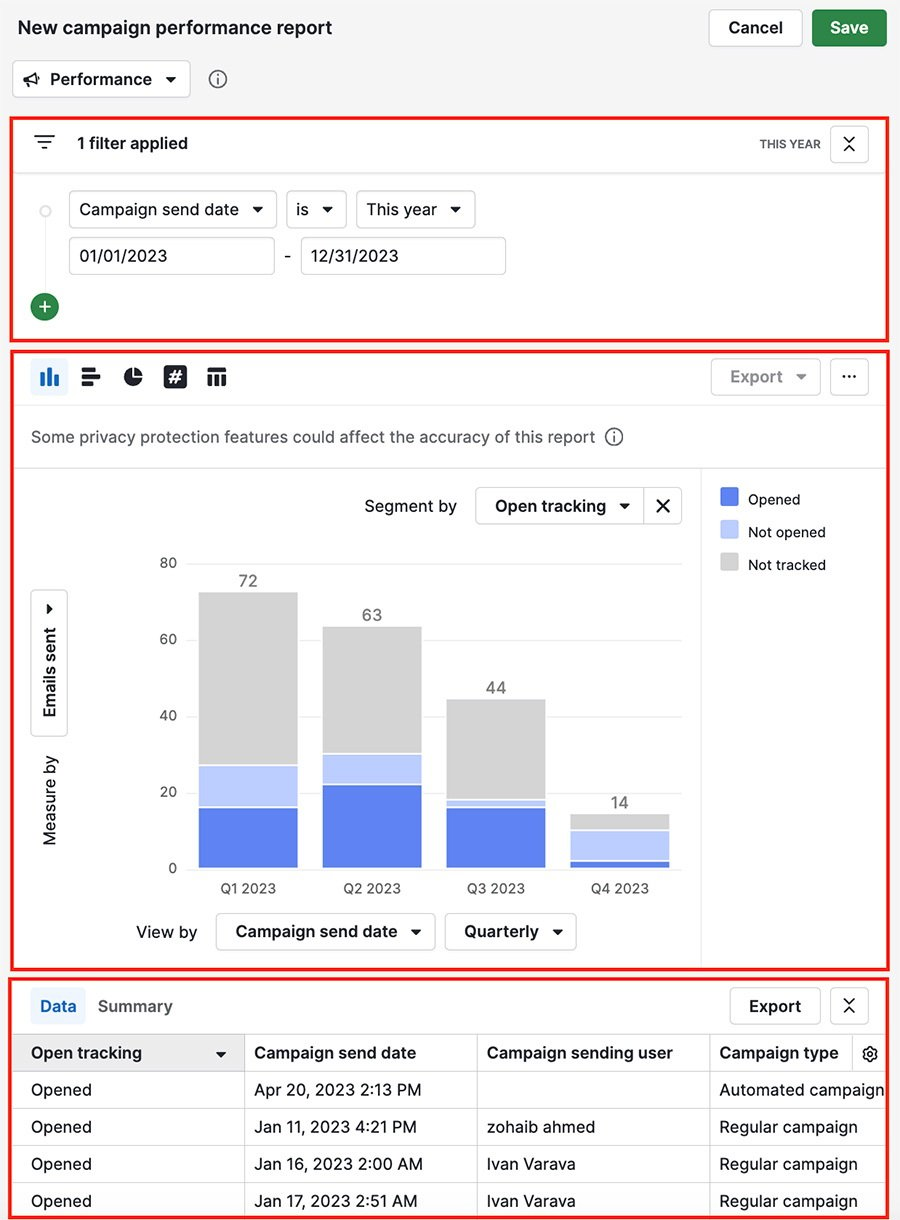
A performance report displays data related to whether your campaign emails were delivered successfully.
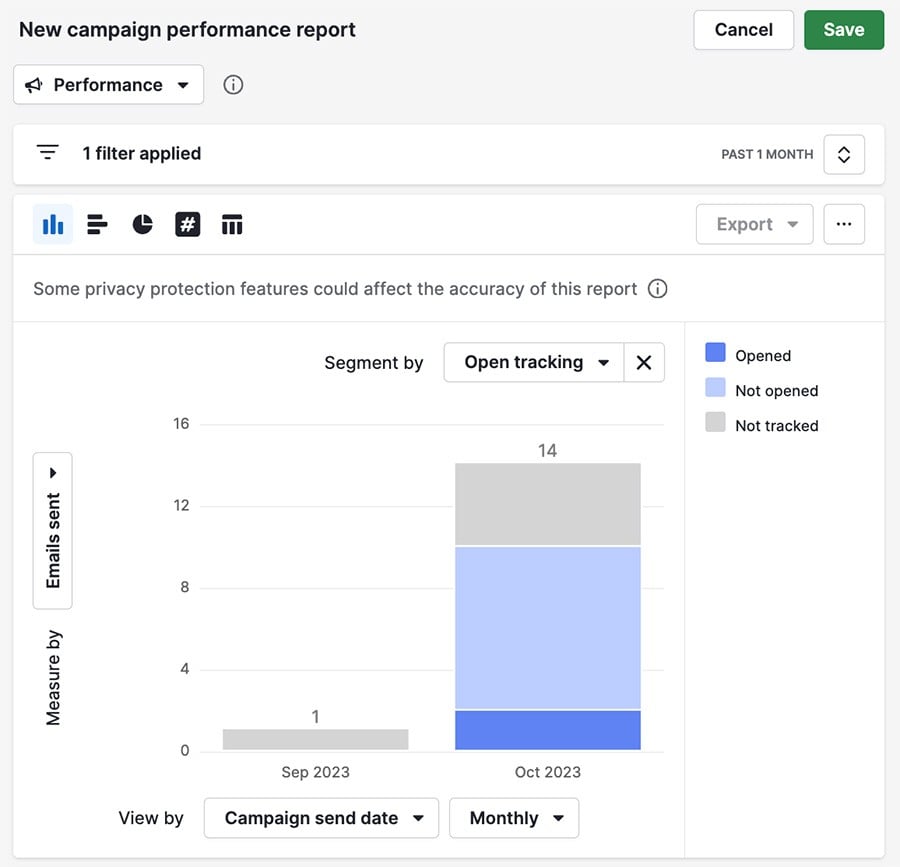
In this example, the report displays the months when campaigns were sent out, with color coding to indicate the number of your campaign emails that were opened vs. emails that were left unopened or couldn‘t be tracked.
Conversion
The conversion report focuses on the number of recipients who opened your emails or clicked the links within them.
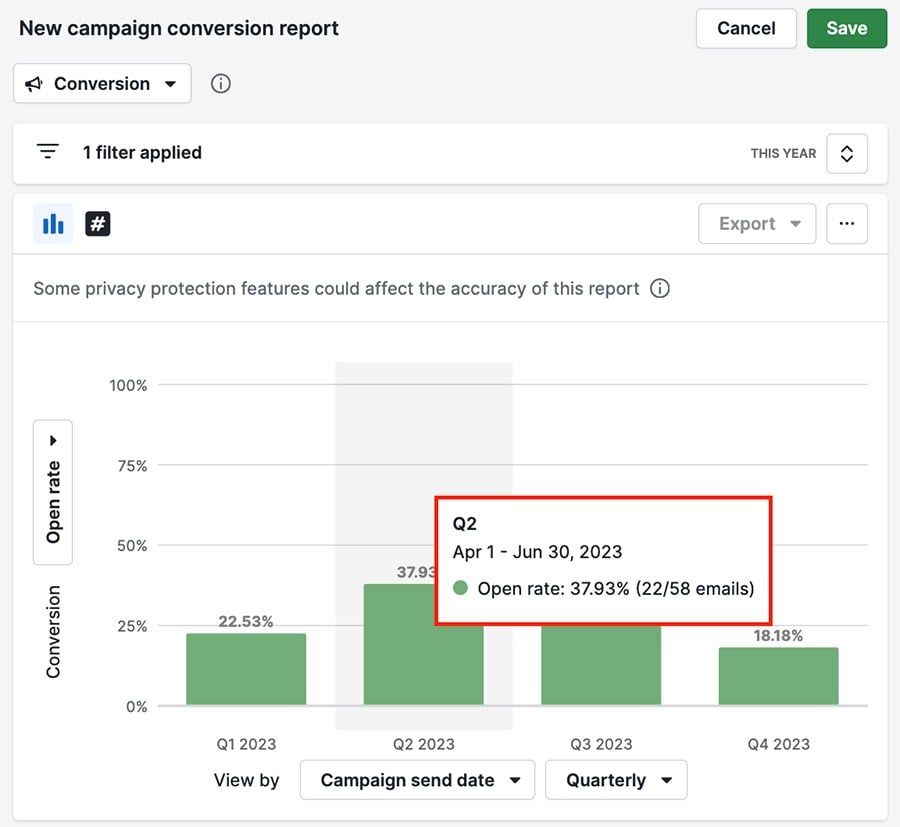
In this example, the open rate for campaign emails is measured based on the calendar quarter they were sent.
Marketing reports structure
In Campaigns Insights, there are three sections that help with building your marketing report: filter view, visual builder and table view.
Learn more about CRM marketing
Filter view
With filters, you can select the marketing data you want to include in your report.
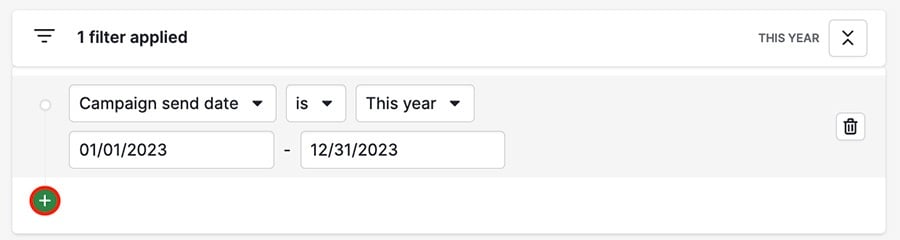
Click the ”+“ button to create a new filter, or hover over an existing filter and click the trash can icon to delete it.
Visual builder
After you select your filters you can choose how that data is visualized.
You can start by selecting a chart type to use in the top left corner.
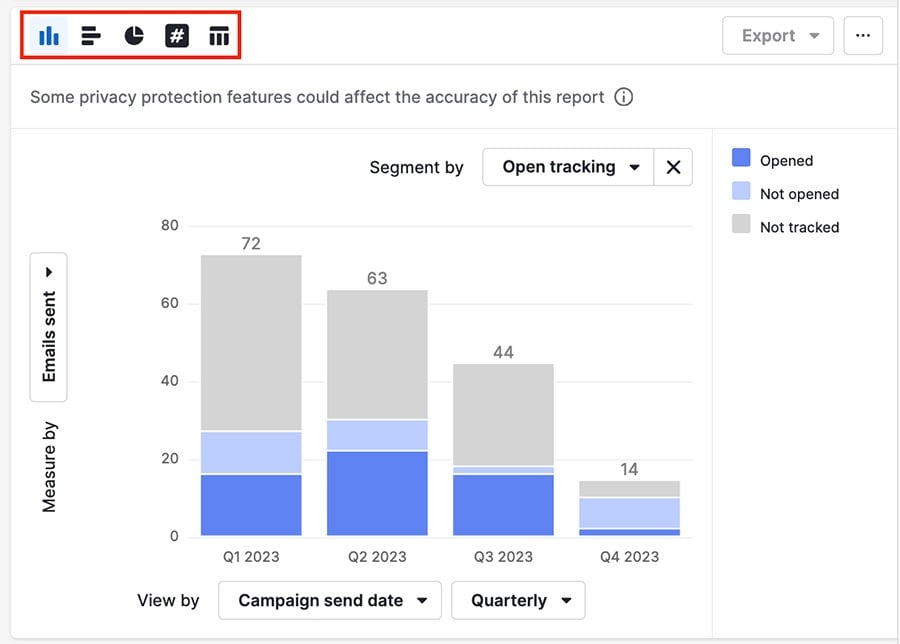
You also have three fields (two if you’re making a conversion report) you can use to further specify how you want your data presented: measure by, view by and segment by.
Measure by
The measure by field shows what’s being counted, such as emails sent, and defines which units are used to present the data.
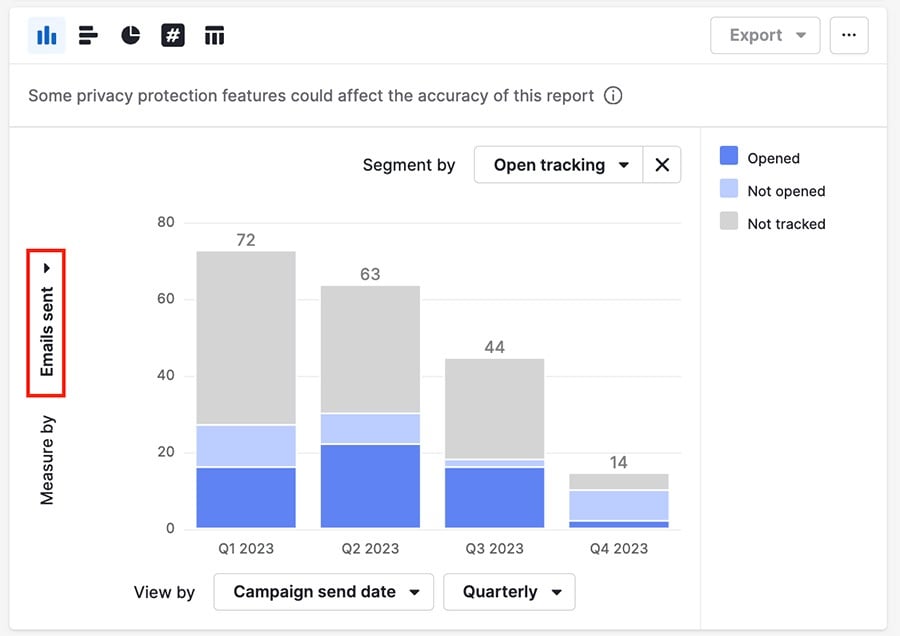
There are five options you can choose from:
Field name | Data represented |
Emails sent | How many emails were sent in the campaign |
Total clicks | How many times recipients clicked on links in your emails, including repeated clicks |
Total opens | How many times emails were opened (including multiple opens by the same person) |
Unique clicks | The number of emails with links that were clicked on. |
Unique opens | The number of emails sent that were opened. |
View by
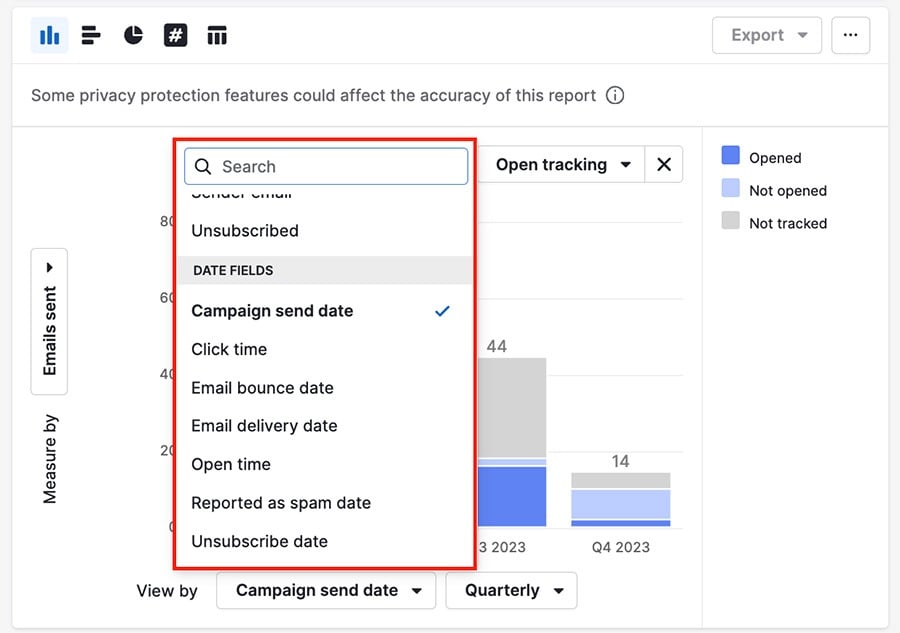
The view by field dictates how to display the information used to split your columns, such as the quarter the campaign was sent.
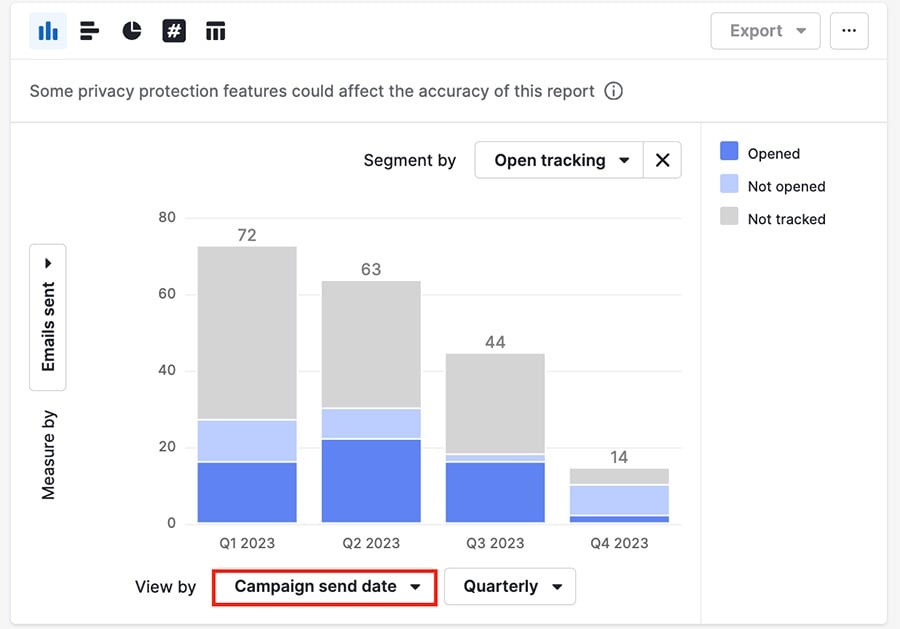
In addition to the fields from the filters section, you can use special date fields here to see your campaign’s performance over time:
Segment by
The segment by field allows you to split the data within your existing filters and is represented by the colors in your columns. This helps you compare groups (like who opened your emails or not) in one chart..
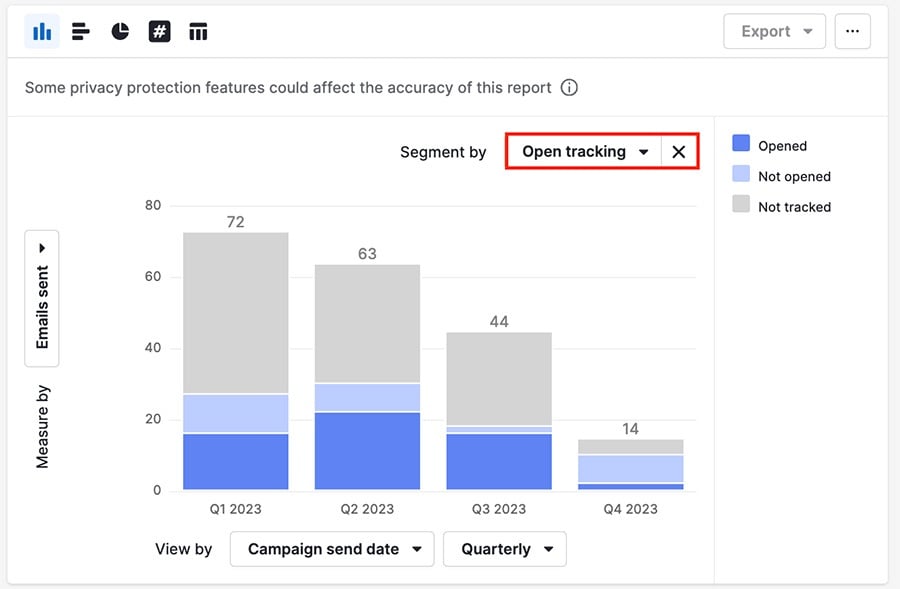
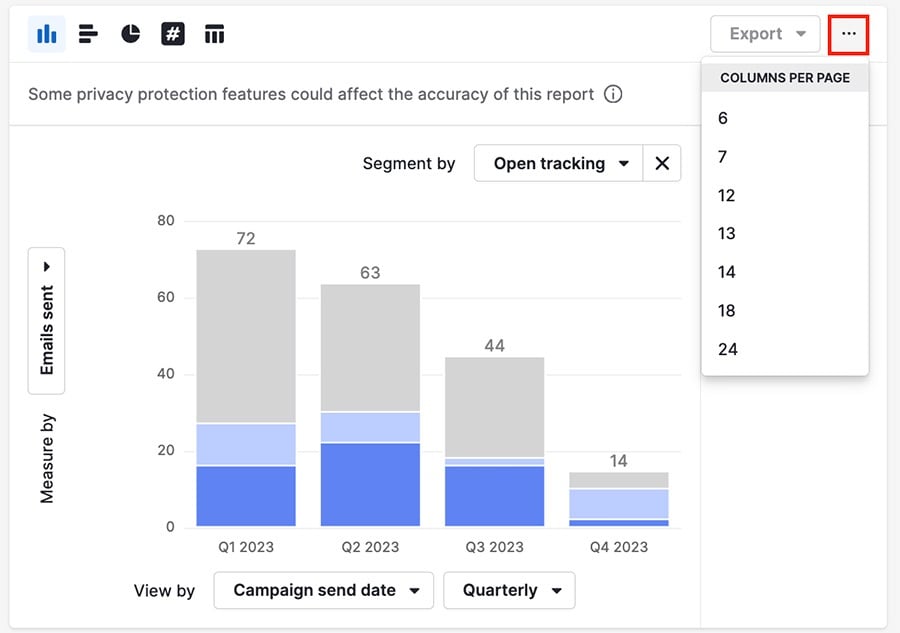
Click the ”...“ in the top right corner to change the number of visible columns.
If at least one of the selected fields includes open or click data, those values are displayed in your report. Open or click data includes:
Open time
Open country
Link
Click country
Click time
Total opens
Total clicks
Otherwise, your report will only include sent email data.
Table view
Once you’ve filtered and visualized your data, you can look at the table view for a spreadsheet layout of the data in the chart.
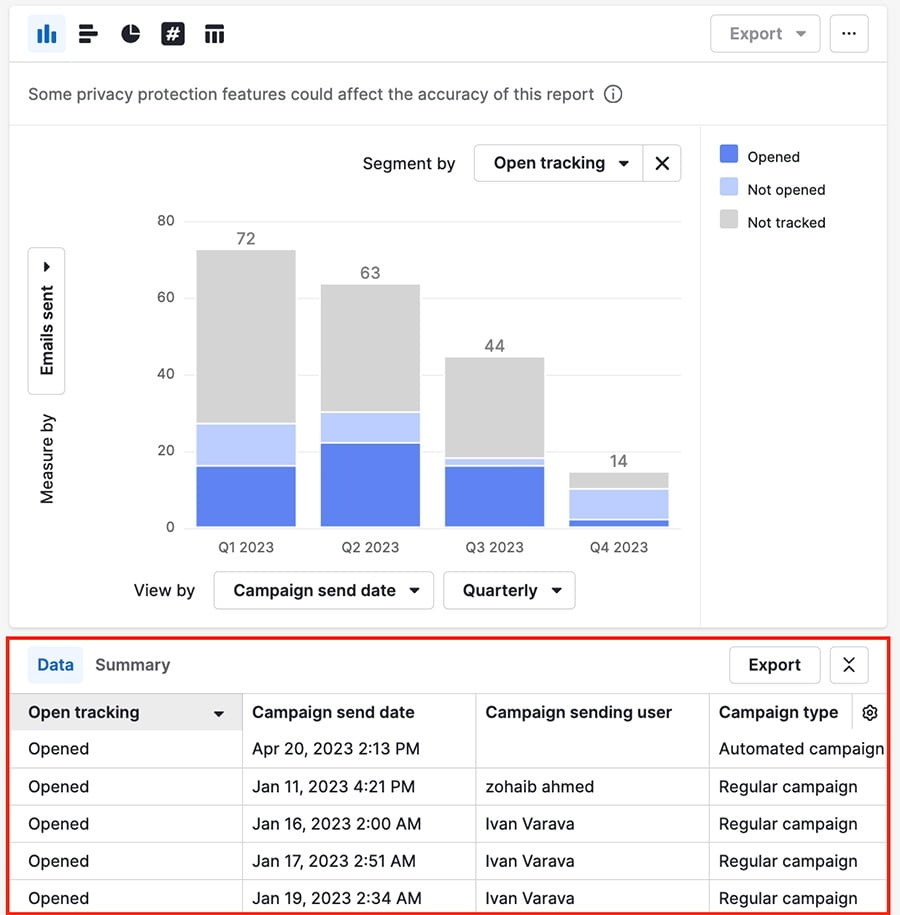
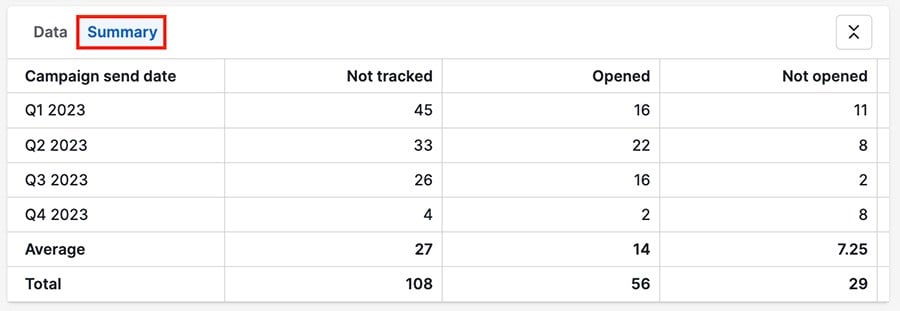
You can choose the data view to display a list view or a summary view, providing a more general breakdown of your report data.
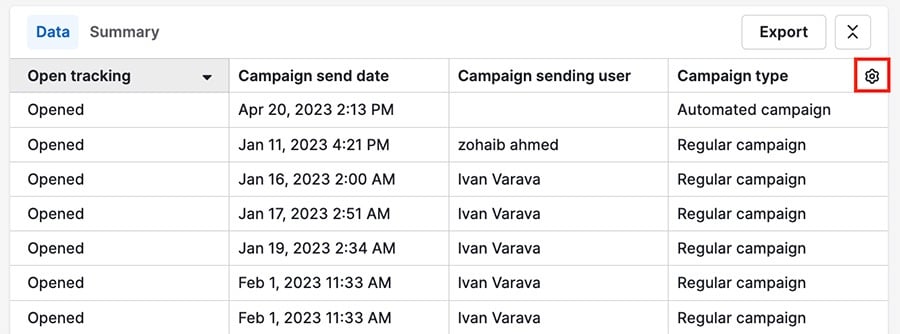
Click the gear icon to change the visible columns, or click “Export“ to download an XLS or CSV document with your report data.
Fields and data
Here’s a comprehensive list of fields available to filter by in a Campaigns report, and what data they represent:
Field name | Data represented |
Campaign | Title of the campaign |
Campaign creator | Name of the Pipedrive user who created the campaign |
Campaign creator status | Can be active or deactivated |
Campaign sending user | Name of the Pipedrive user who sent the campaign |
Campaign sending user status | Can be active or deactivated |
Campaign type | Can be regular or automated |
Click tracking | The events listed can be clicked, not clicked or not tracked |
Delivery status | Can be:
|
Email bounce type | Reasons why a mail server may bounce an email:
|
Open tracking | The events listed can be opened, not opened or not tracked |
Recipient | Name of recipient in your contact list. You can type to start searching |
Recipient email | Type to start searching for an email address |
Reported as spam | Can be yes or no |
Sender company | Type to start searching for the sender company name |
Sender domain name | Name of the domain used to send the campaign |
Sender email | Type to start searching for the sender‘s email address |
Sender name | Type to start searching for the sender‘s name |
Unsubscribed | Recipients who unsubscribed using the unsubscribe link in a certain campaign |
Date fields | |
Campaign send date | Date range the campaign was sent |
Email bounce date | Date range showing bounced emails |
Email delivery date | Date range showing when emails were delivered |
Reported as spam date | Date range showing when emails were marked as spam |
Unsubscribe date | Date range showing when emails were unsubscribed to |
Was this article helpful?
Yes
No