Campaigns Insights: conversion reports
To improve your marketing campaigns, it’s crucial to know how well your emails are reaching your audience. With the campaigns conversion report, you can see statistics related to message deliverability, like:
- Open and click rates
- Reported as spam rates
- Click through rates
Creating your Insights conversion report
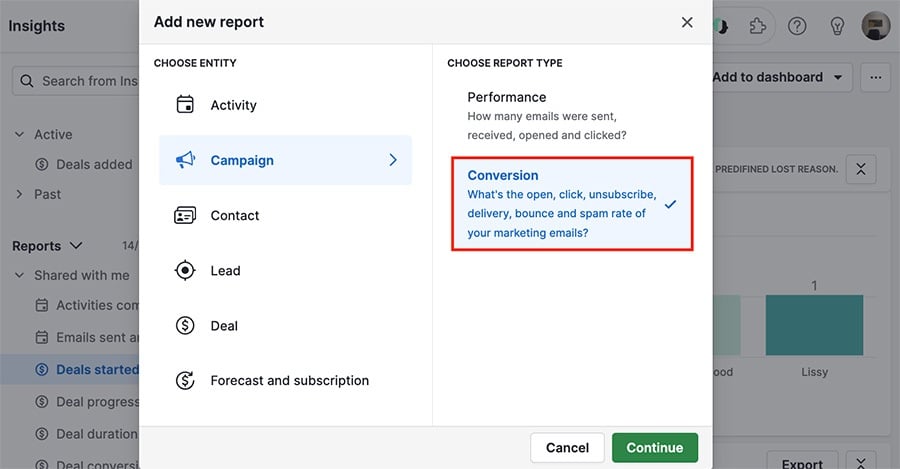
To create a new Campaigns conversion report, go to Insights and click ”+“ > Report > Campaign > Conversion.
Viewing your Insights conversion report
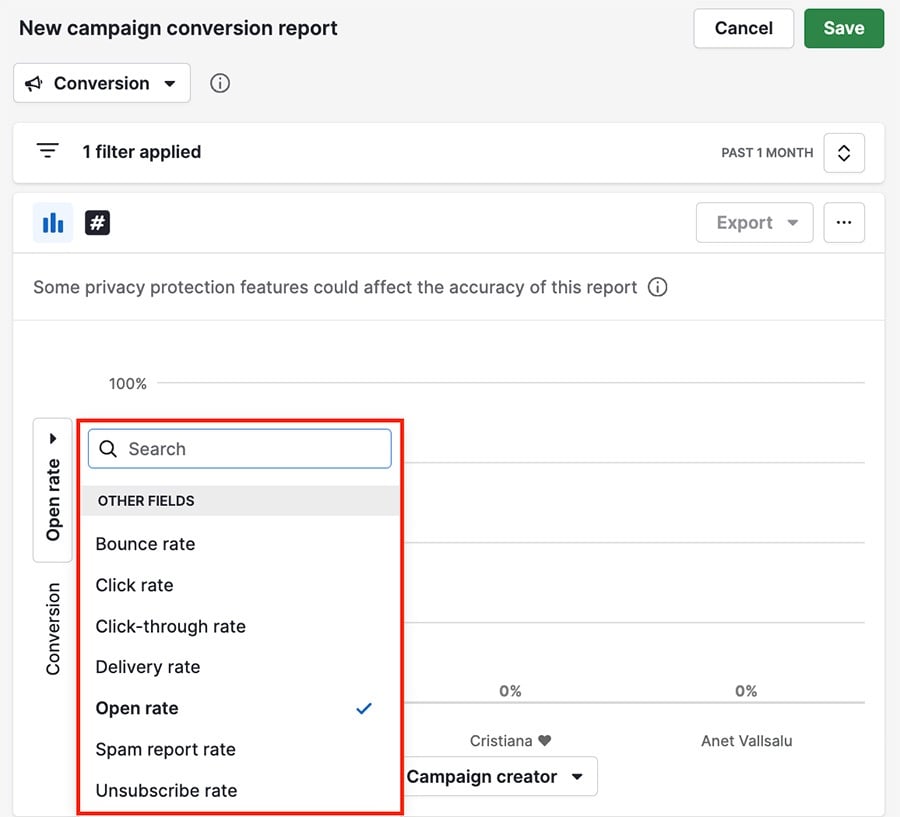
While most Pipedrive Insights reports have a measure by field, Campaigns conversion reports have a conversion field instead.
You can also hover your cursor over any column in your report to see the data contained there.
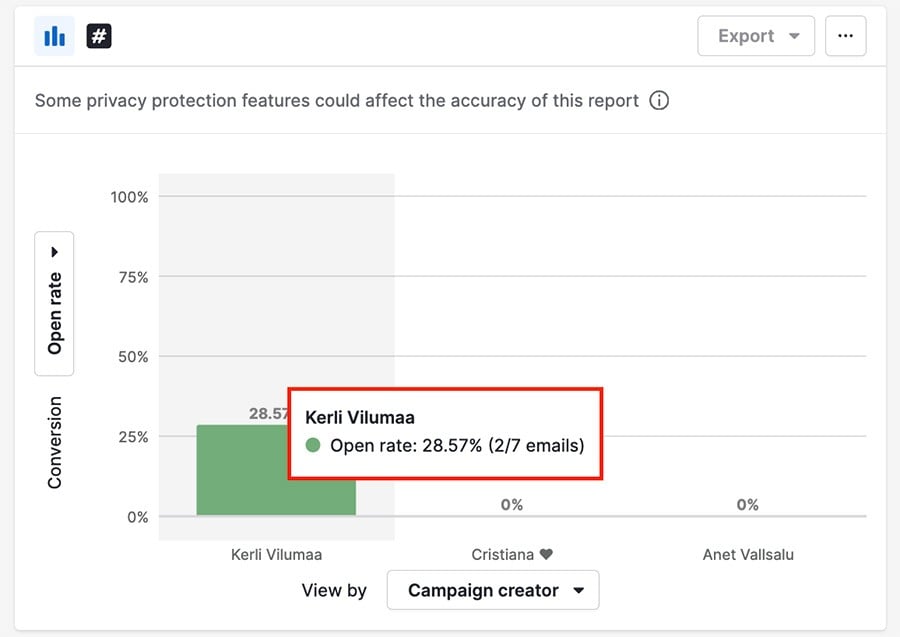
In this example, the user has sent seven campaign emails in the filtered time span, and two of those emails have been opened.
Conversion specific fields
Here is a chart showing the fields available in the report and how those conversions are calculated.
Conversion field | What does it mean | How this conversion metric is calculated |
Open rate | Recipients who opened an email at least once | Sum of unique opens / All delivered emails |
Click–through rate | Recipients who clicked on at least one link in an email | All recipients who clicked / All opened emails |
Spam report rate | Recipients who marked sent emails as a SPAM | Sum of reported as SPAM recipients / All delivered emails |
Unsubscribe rate | Recipients unsubscribed from a mailing list after receiving an email | Sum of unsubscribed recipients / All delivered emails |
Delivery rate | Emails successfully delivered to recipients’ inboxes | Sum of delivered emails / All emails sent |
Click rate | Recipients who clicked on at least one link in an email at least once | Sum of unique clicks / All delivered emails |
Bounce rate | Emails not delivered to recipients’ inboxes due to specified reasons | Sum of bounced emails / All emails sent |
Was this article helpful?
Yes
No