Exporting data from Insights
You can export charts and data from the Insights feature to use in presentations, share with external stakeholders or archive for future reference.
Whether you need a visual snapshot or a detailed spreadsheet, exporting makes it easy to work with your Pipedrive data outside the platform.
Exporting charts
You can export charts from your reports, dashboards and goals. Here’s how each export looks:
Exporting reports
Open a report and click ”Export“.
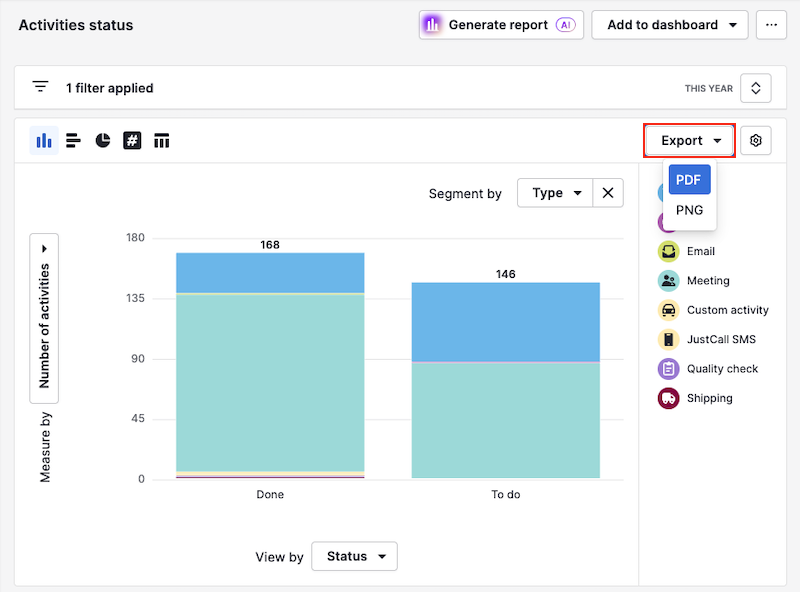
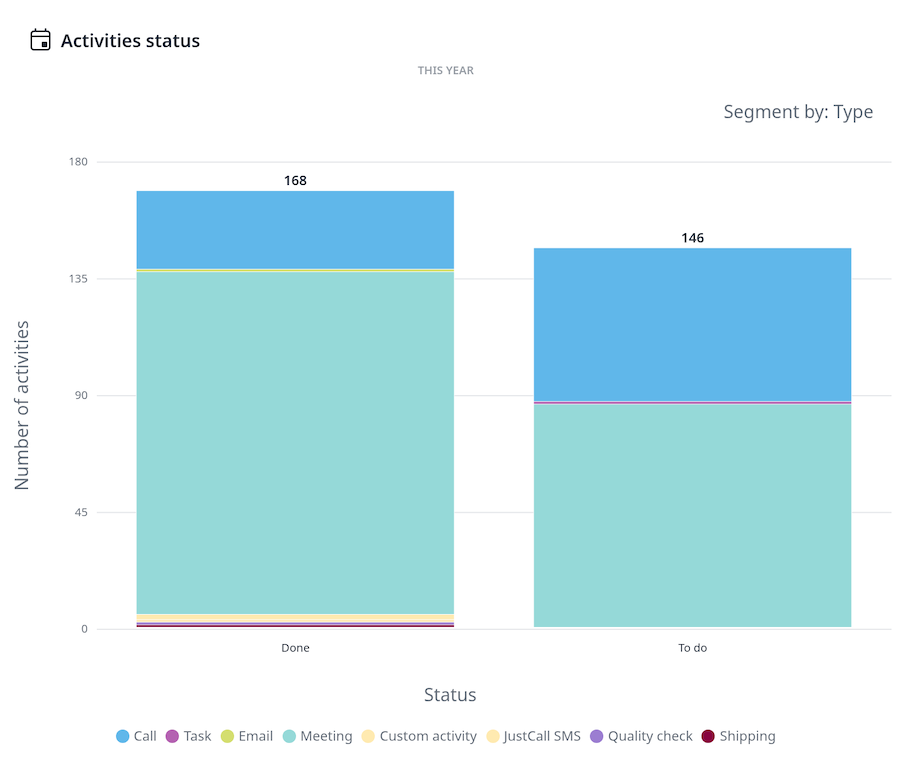
Your exported file displays the current chart view and applied filters.
Exporting dashboards
Open a dashboard, click “...“ and then select “PDF export” or “PNG export”.
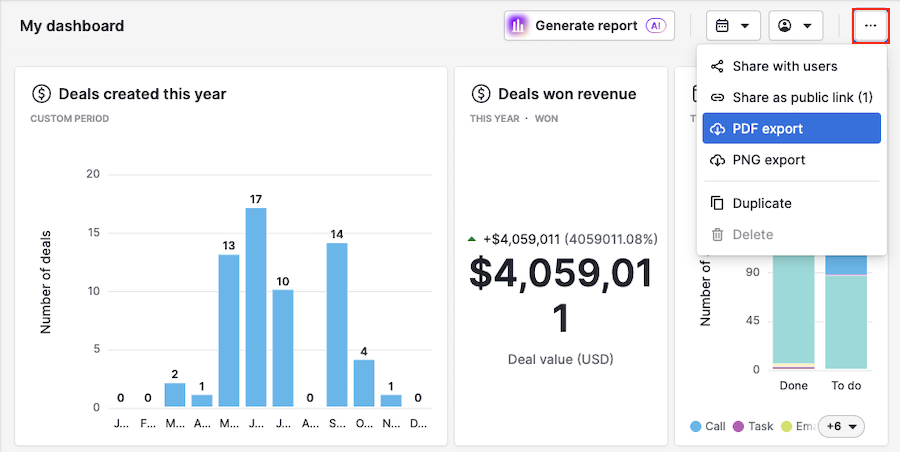
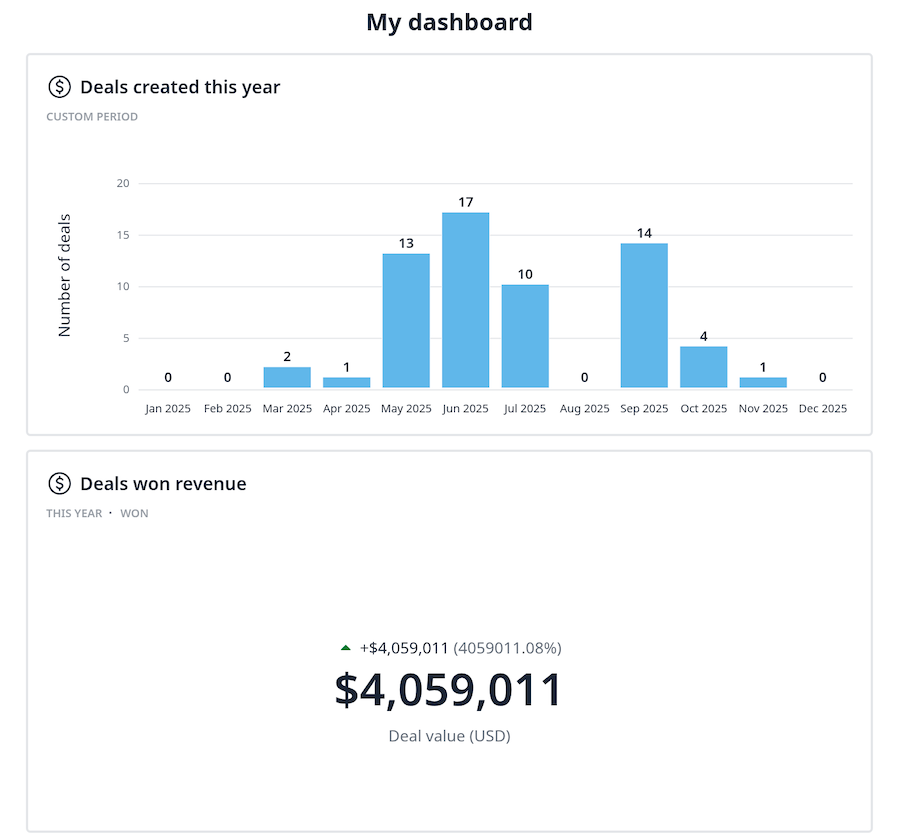
Your exported dashboard includes all visible reports, in their on-screen order.
Exporting goals
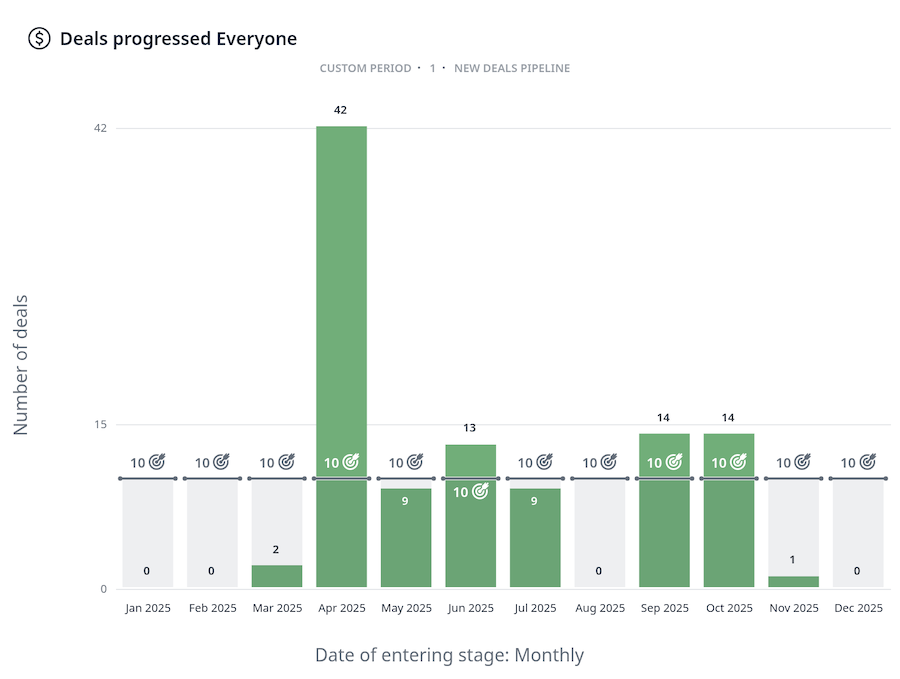
Open a goal and click “Export“.
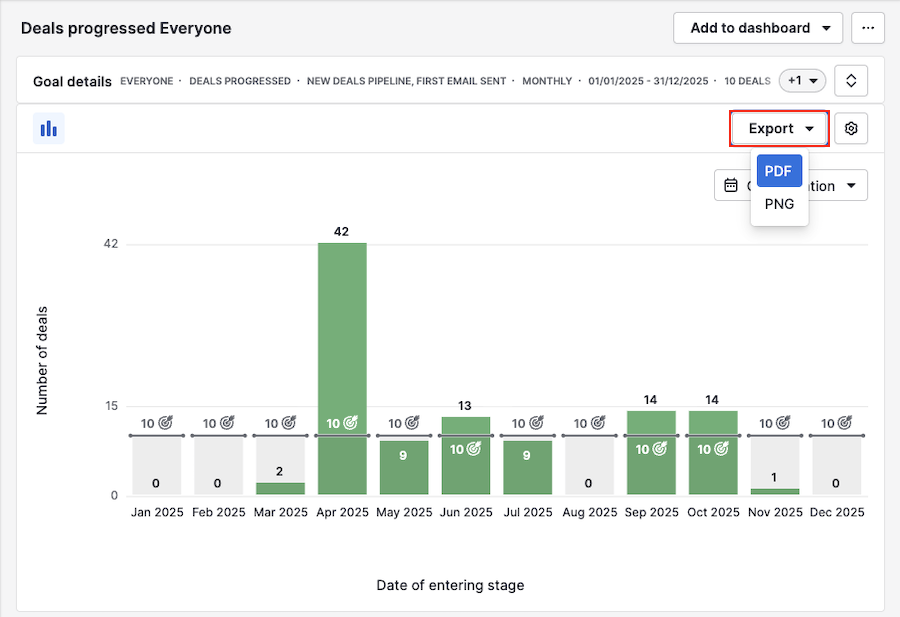
Your exported file displays your goal metrics exactly as shown in the app.
Exporting data to spreadsheets
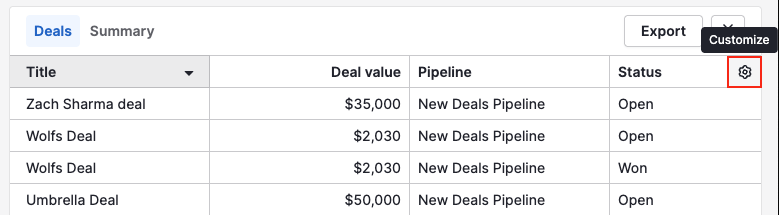
To export data to a spreadsheet, open a report or goal and scroll to the table view at the bottom of the page.
Use the gear icon to choose which columns to include in your file.
Once ready, click ”Export“.
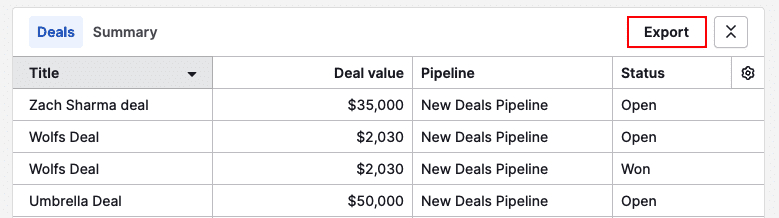
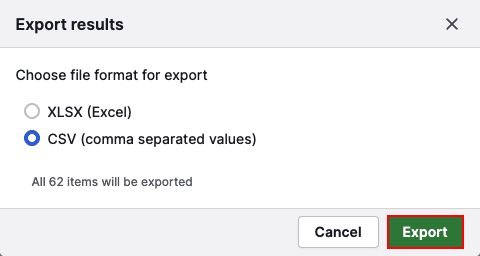
Finally, choose between XLSX and CSV as the file type, then click ”Export“.
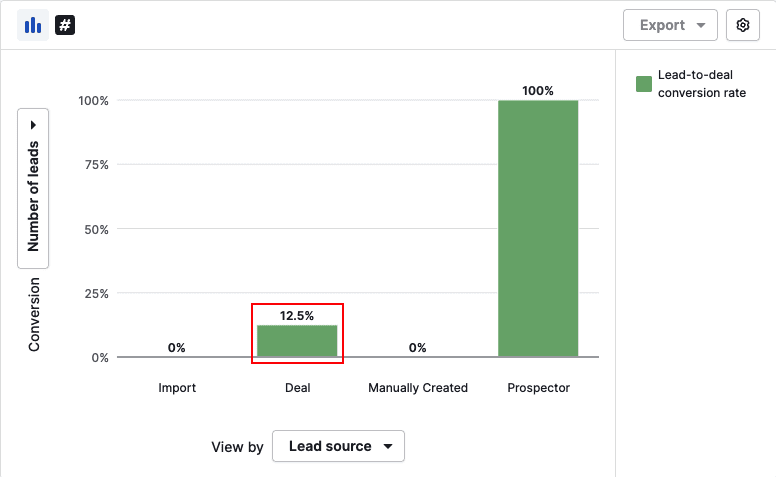
Exporting data from a specific chart column
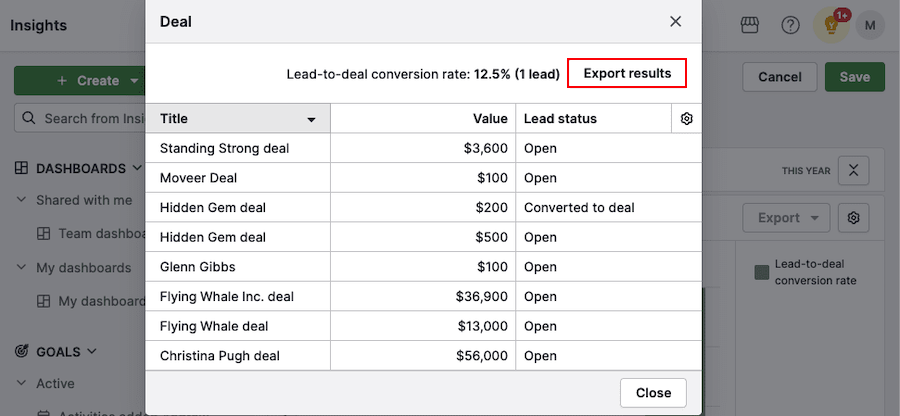
To export data shown in a specific column of the chart, click that column to open its detailed table view.
You can then customize which columns are included in your file by clicking the gear icon.
Click “Export results” to download the data.
Was this article helpful?
Yes
No