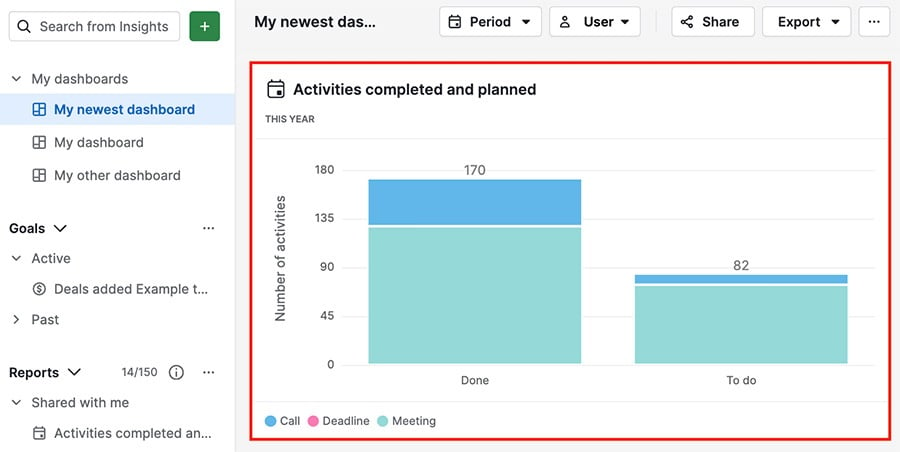
Insights: dashboards
The sales dashboard is a customized collection of reports you collate and display.
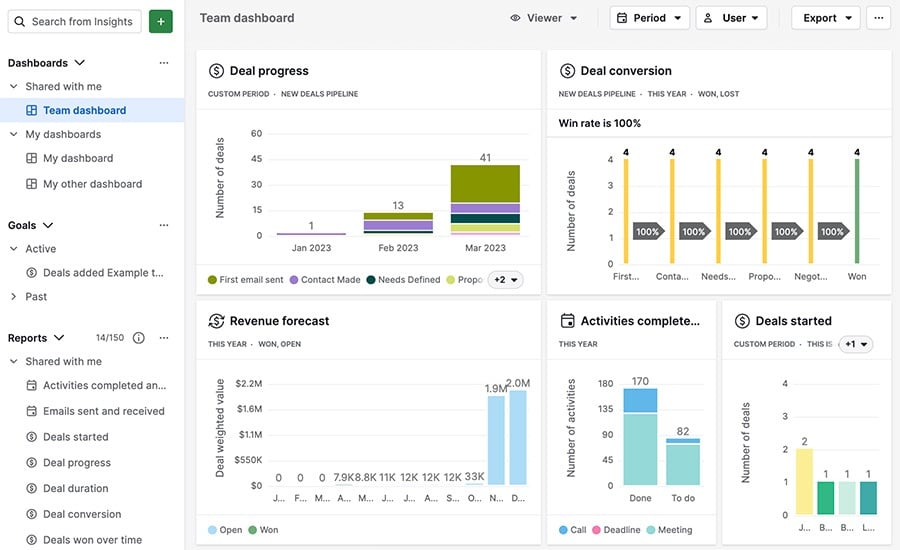
With an Insights dashboard, you can:
- Customize by adding and sorting your desired reports.
- Share your dashboard with people in and outside of Pipedrive
- Show multiple pieces of reporting data in one shared window
Learn how creating a sales dashboard will help you measure your sales in this blog entry.
Creating a dashboard
To create a new dashboard, go to Insights and click ”+“ > Dashboard.
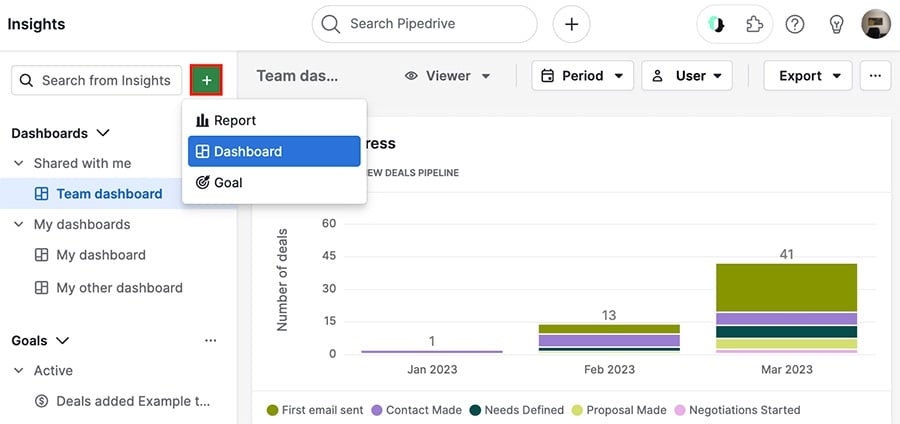
You‘ll be asked to provide a name and section for your dashboard.
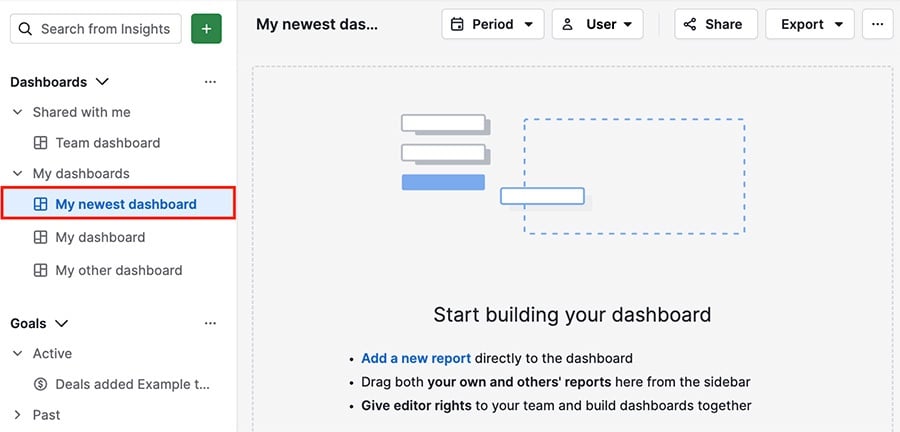
Once you click ”Save,“ you’ll see your new dashboard under the specified section and an empty board on the right.
Adding reports to your dashboard
Once you’ve created your dashboard, you can add reports to it using two methods.
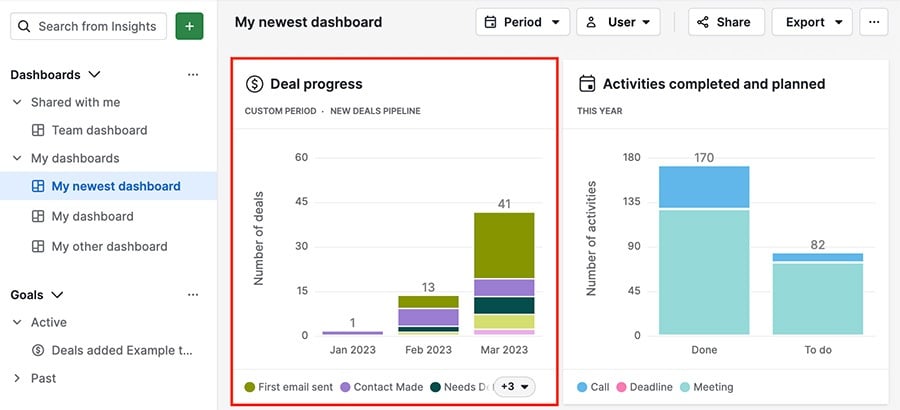
Drag-and-drop
If you’ve already created reports in your Insights, you can drag reports from the left side panel directly into your dashboard.
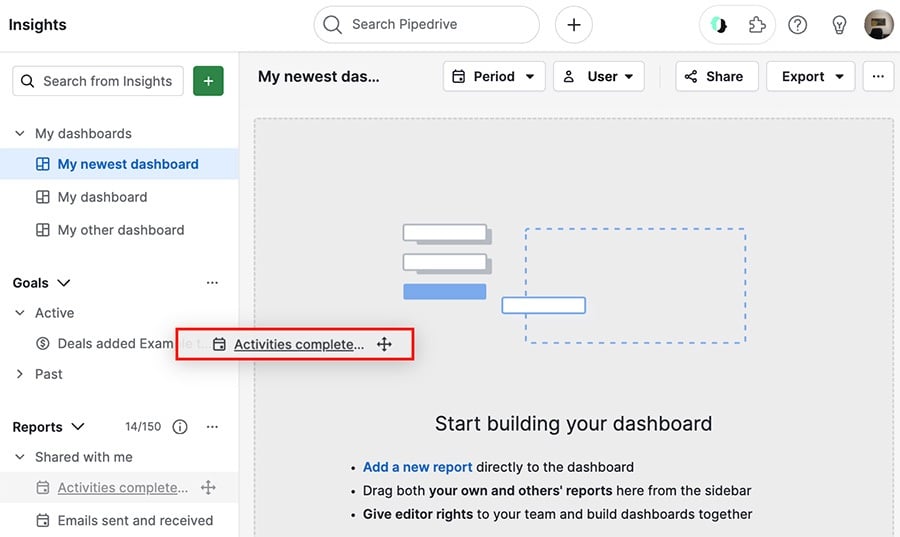
The report will appear in your dashboard after you’ve dragged it in.
Report view
You can also add reports to your dashboard by opening one and clicking ”Add to dashboard.“
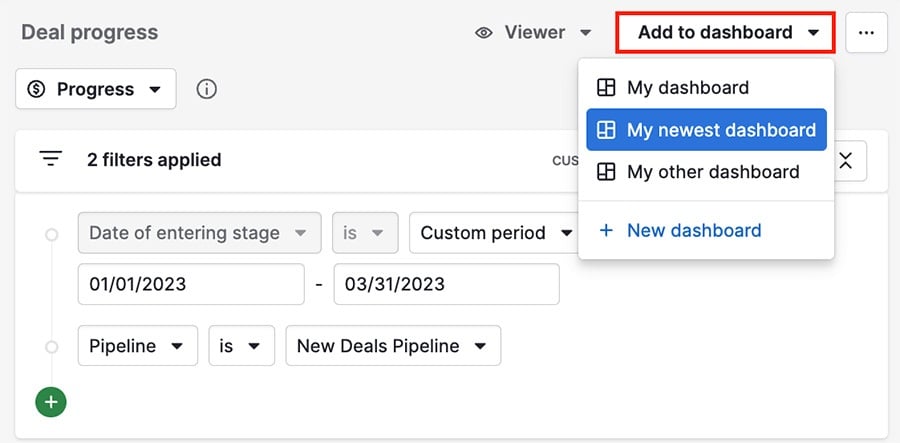
After you select a dashboard for your report, you can open that dashboard and see it there.
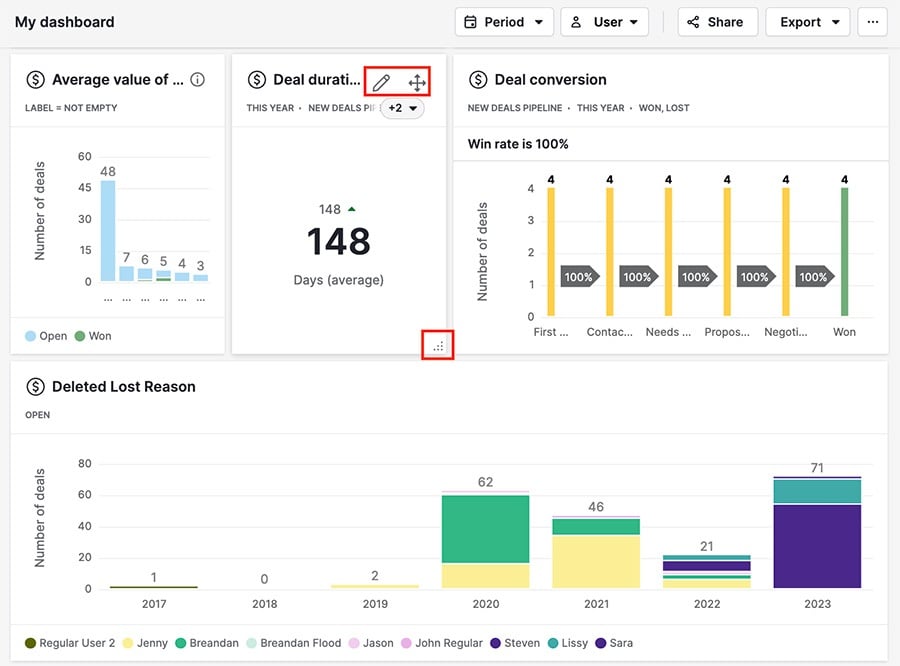
Customizing your dashboard
The best thing about the Insights dashboard is that you can both resize and arrange your reports however works best for you.
There are several tools you can use in the dashboard to customize your view:
- Pencil icon – takes you to the editor view for that report
- Move icon – hold this down to drag your report anywhere on your dashboard
- Resize icon – lets you stretch and shrink the size of your reports on the dashboard
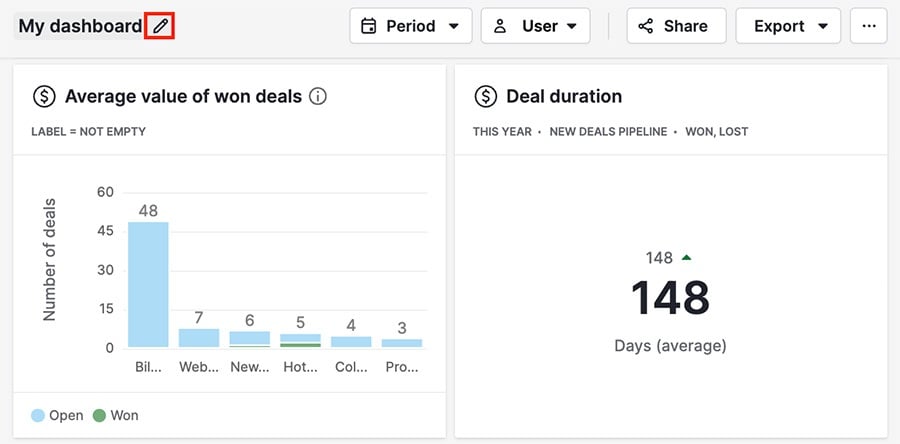
If you want to rename your dashboard, hover your cursor over the existing name and click the pencil icon.
Filters
You also have filters you can use to change the data being displayed in your dashboard.
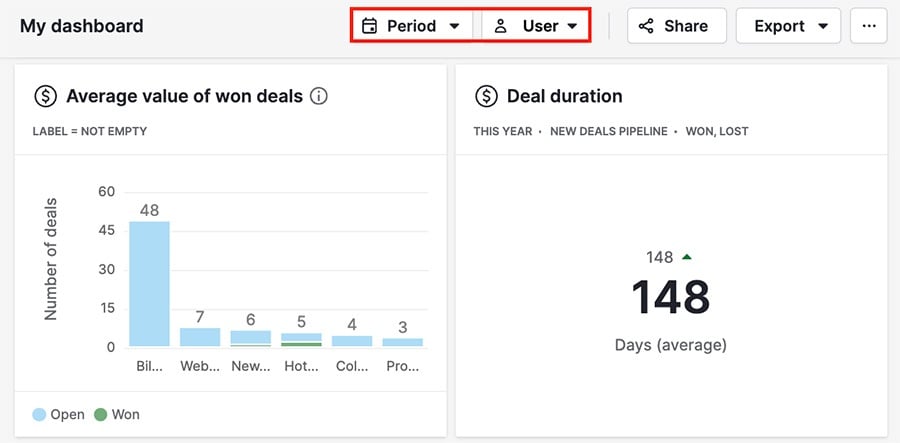
- Period – shows data from within a fixed time period
- User – shows data linked to a specific user in your account
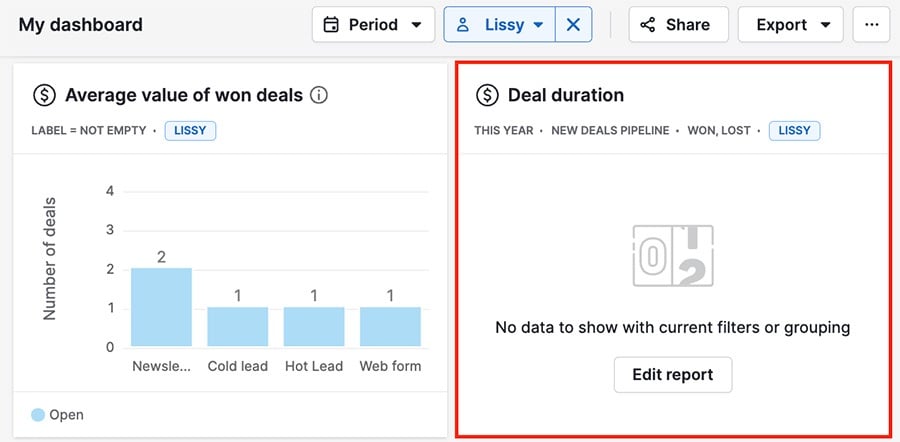
If a filter you apply removes all of the data from a report, you’ll still see the empty report in your dashboard.
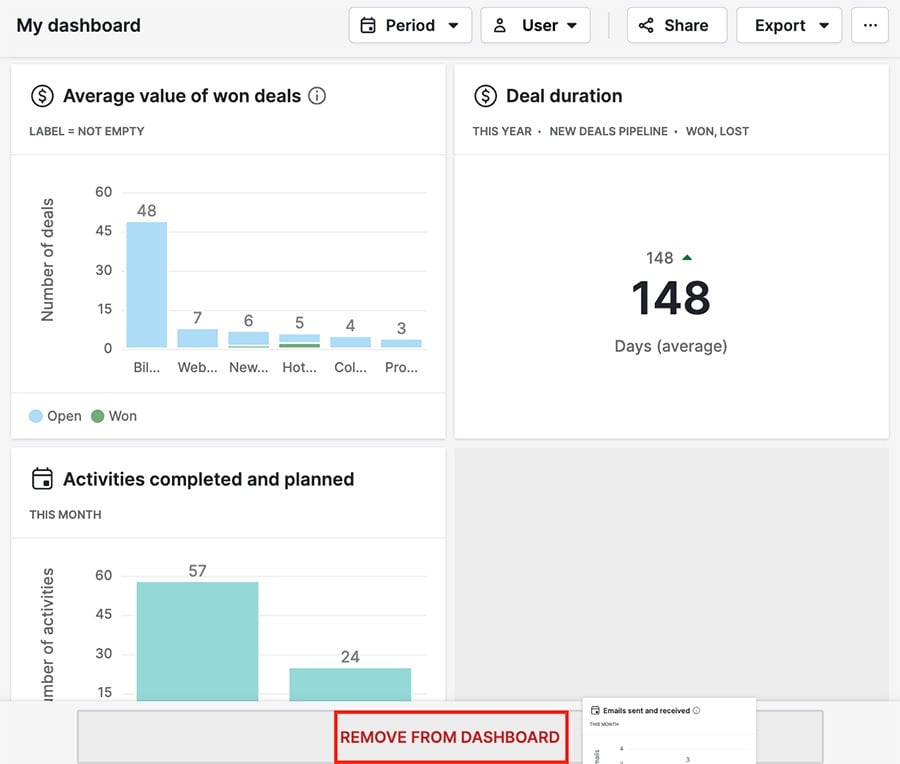
Deleting items
If you want to remove a report from your dashboard, use the move icon to drag the report to the bottom of the screen where it says remove from dashboard.
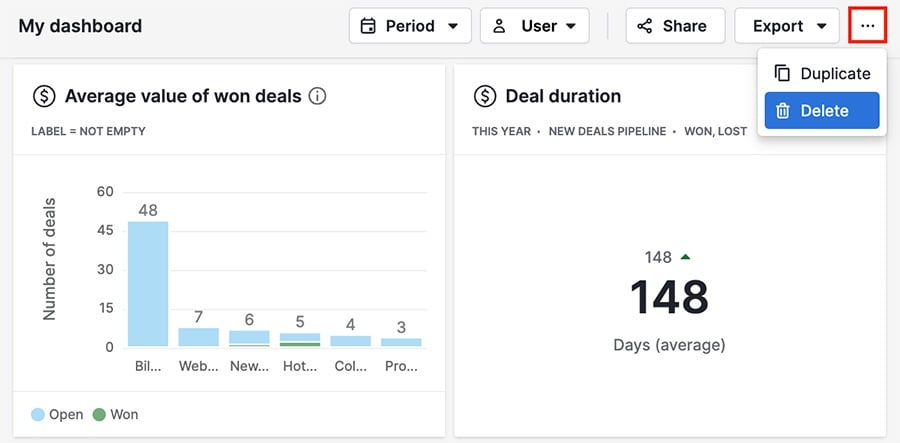
To delete a dashboard entirely, click ”...“ > Delete in the top right corner.
Sharing your dashboards
You can make your Insights dashboards visible to other people in a couple of different ways.
Sharing
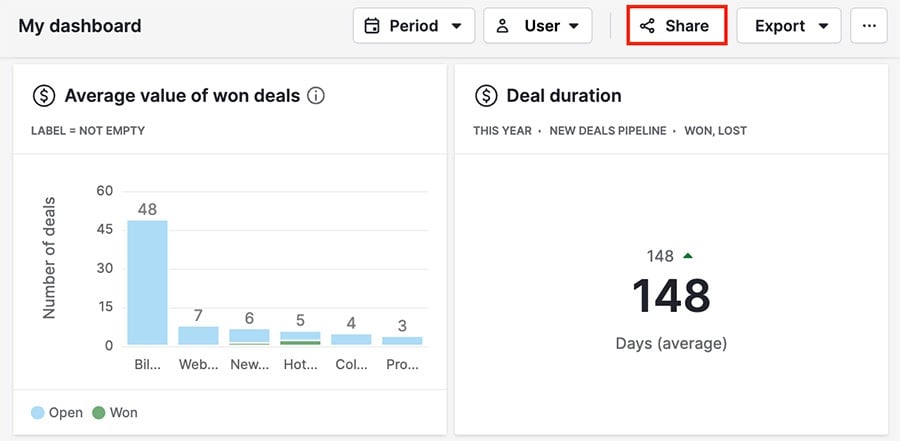
You can share your dashboard by clicking the ”Share“ button in the top right corner.
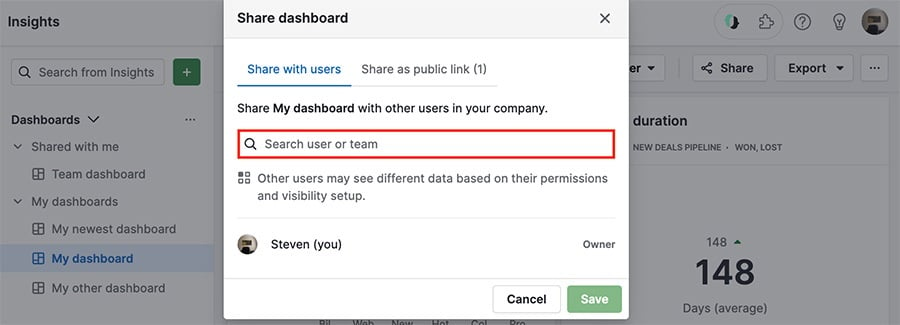
The first option you’ll have is to share internally with your team members. Click the search bar to see a list of team members you can share with, or type a name in directly.
You can also click ”Share as public link“ to generate a link you can send to people outside of your Pipedrive account.
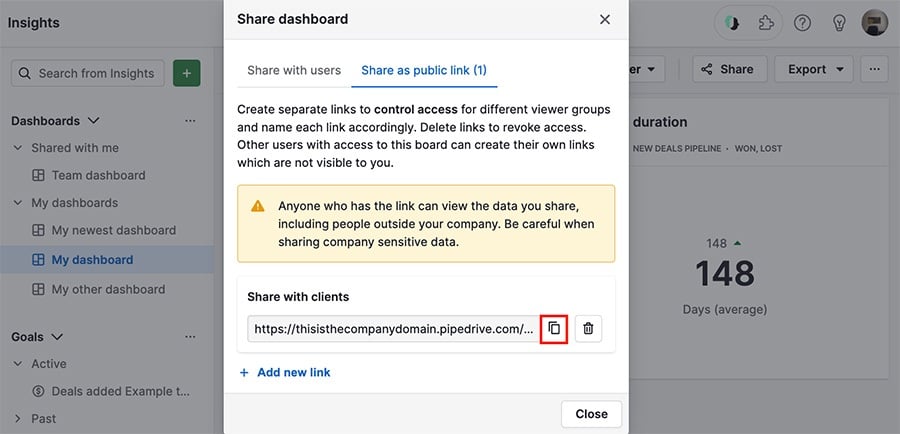
Click the copy icon to copy the link to your clipboard, or select ”+ Add new link“ to generate a different link to share.
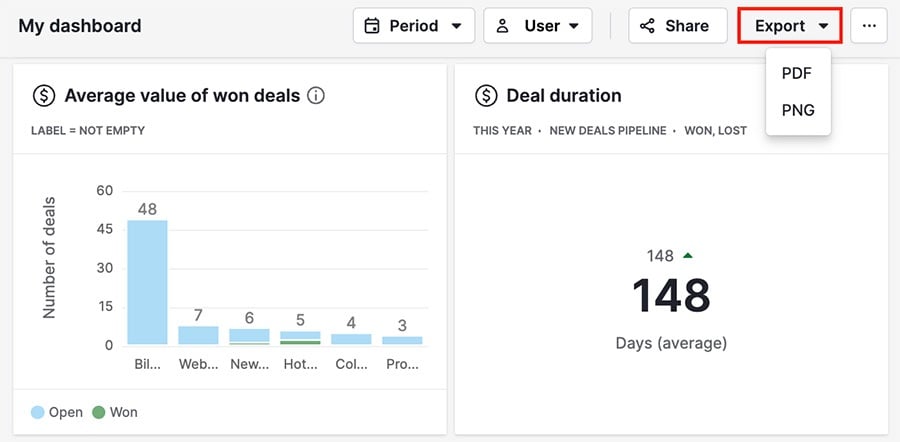
Exporting
You can also export a PDF or PNG copy of your dashboard to your device, so you can save it or distribute it.
Update intervals
To change the update intervals for a shared dashboard, two conditions must be met:
- You have to be the creator of the dashboard link
- The link has to be opened in the browser it was created in
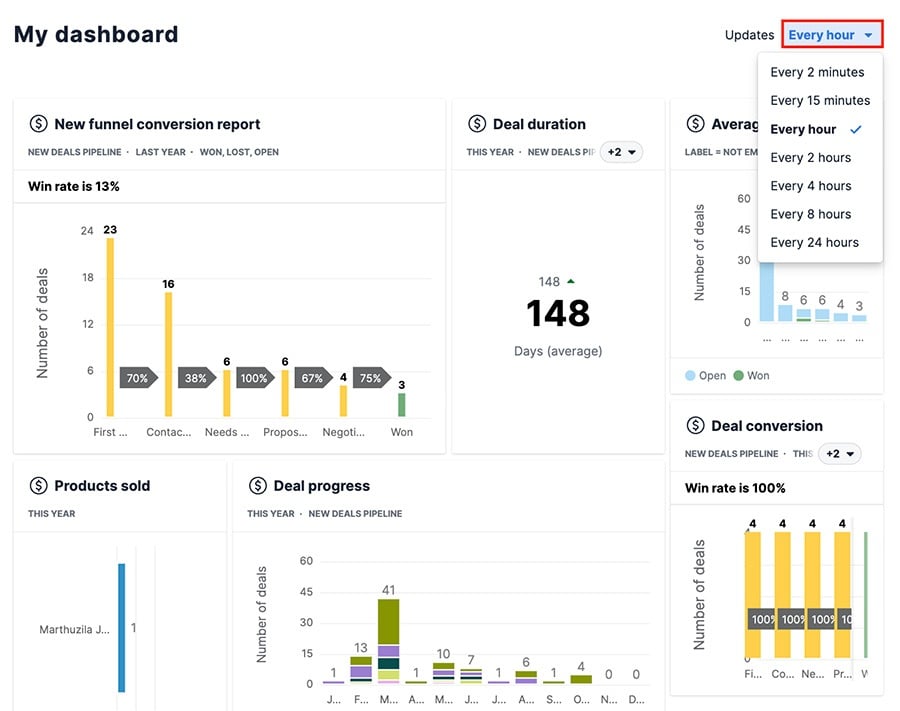
If a different user opens the link, they’ll see the default update interval (one hour.)
Was this article helpful?
Yes
No