Insights reports: deal revenue forecast
Pipedrive‘s Insights deal revenue forecast report enables you to estimate your future revenue so you can better understand what deals have been closed and what deals need to be closed.
This lets you plan your time while accurately estimating the resources available to you in the future.
Creating your deal revenue forecast report
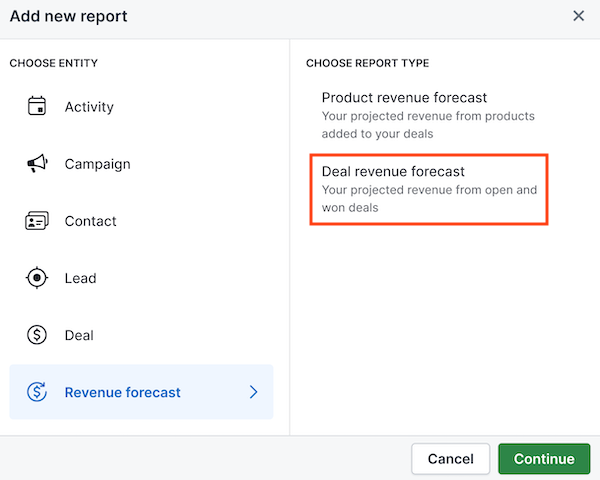
To create your deal revenue forecast report, go to Insights and click “+” > Report > Revenue forecast > Deal revenue forecast.
Viewing your deal revenue forecast report
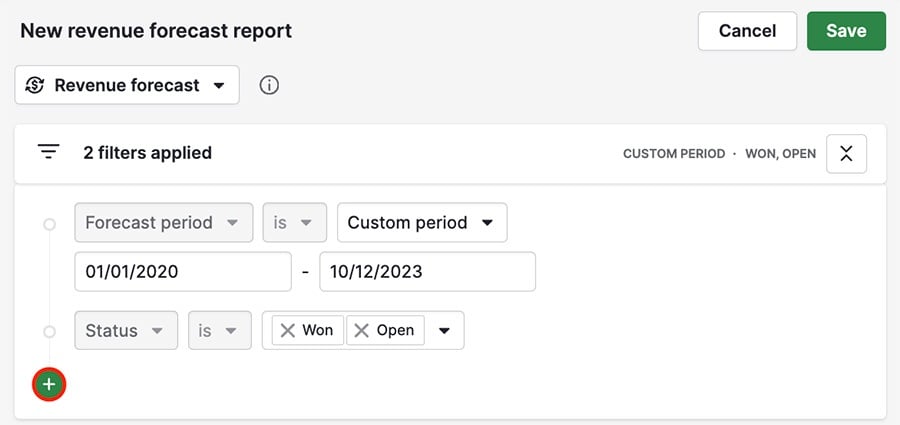
The Revenue forecast report has the following default filter conditions:
- Forecast period > is
- Status > is
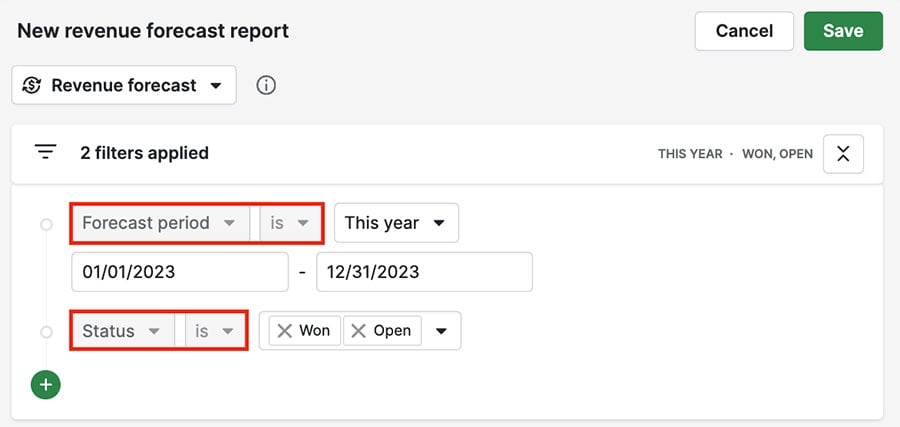
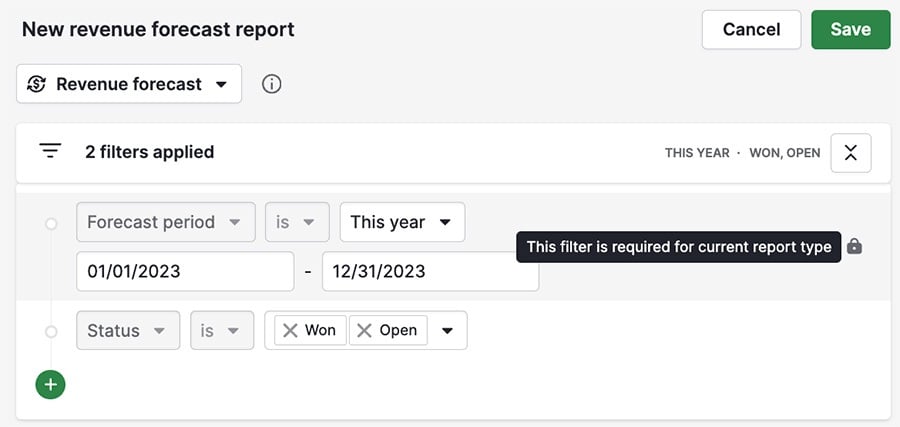
These filters can’t be removed, but you can edit the time period and the statuses filtered.
Hover over a column in your report to see a breakdown of your existing and predicted revenue.
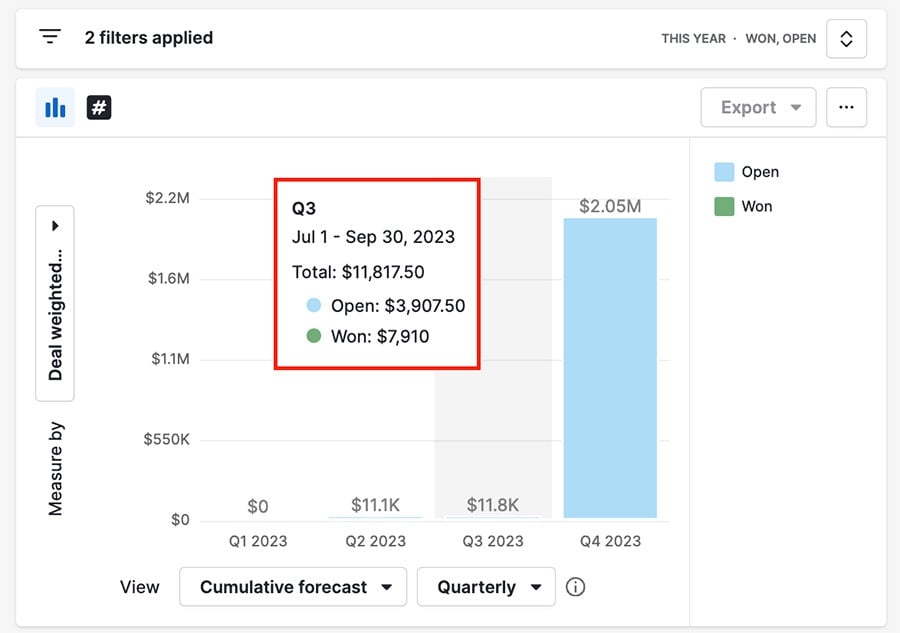
Cumulative forecast
When viewing your cumulative forecast, the amount of revenue generated/predicted is shown in each bar in the report, indicating the accumulated revenue over the selected timeframe.
- Open deals – take the expected close date into account.
- Won deals – take into account deal won time
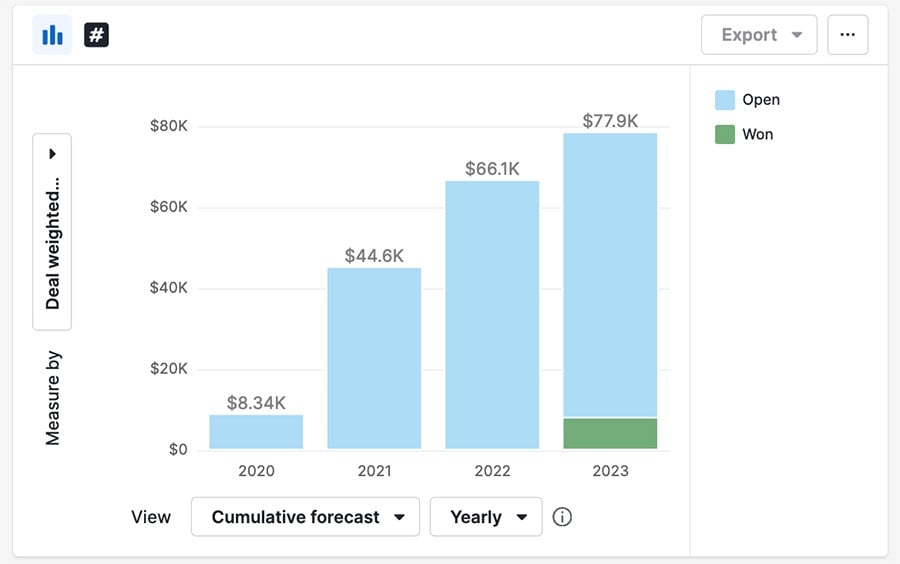
Regular (non-cumulative) forecast
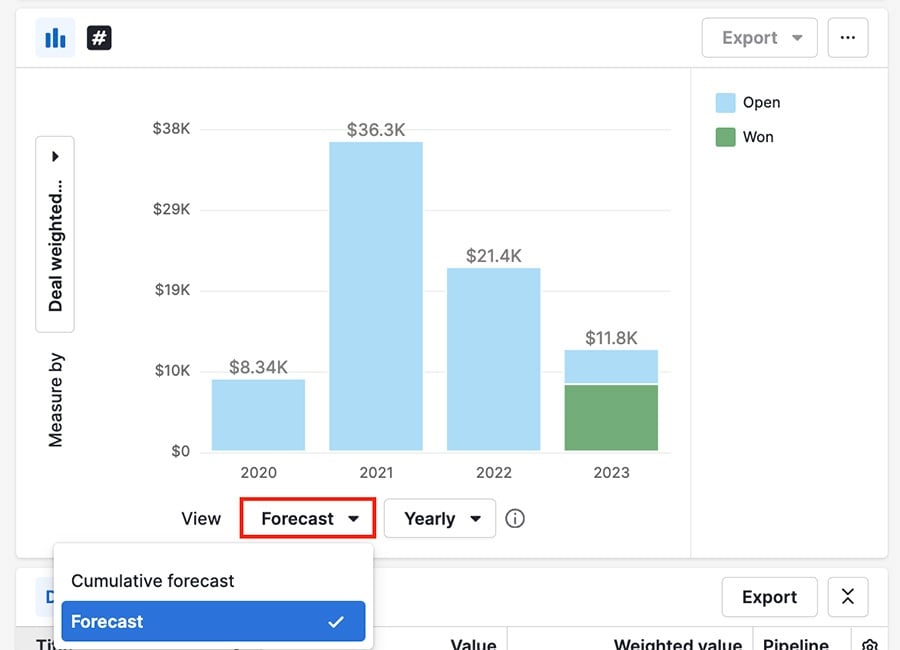
In the view by (X-axis) filter, select ”Forecast“ to view your report non-cumulatively. This shows your generated and expected revenue, segmented by the time frame you set in the view by filter.
Customizing your deal revenue forecast report
The deals you see in your reports can be adjusted in the filtering section at the top of the report. You can edit the existing filters or click the ”+“ to add a new filter.
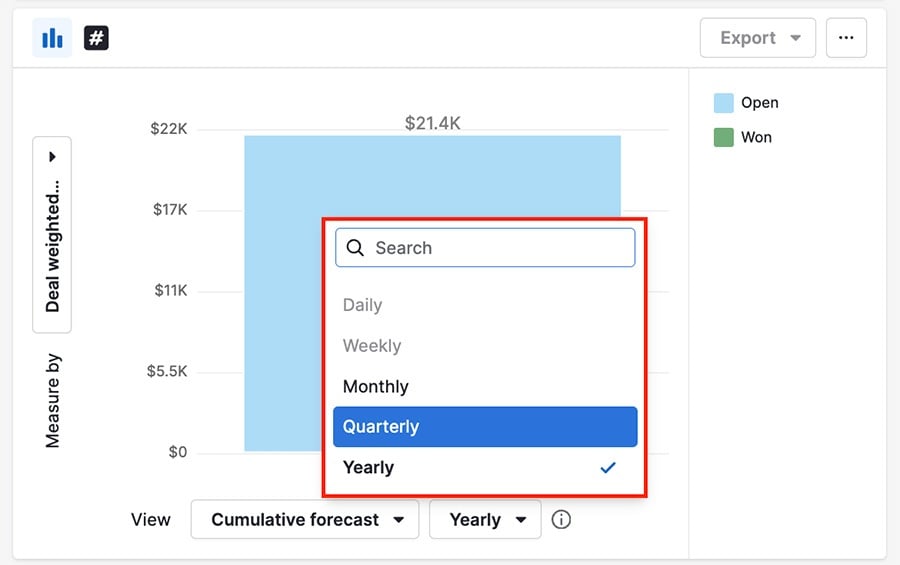
The view by (X-axis) filter is set to Cumulative forecast > Monthly by default, but you can change the time frame or choose forecast rather than cumulative forecast.
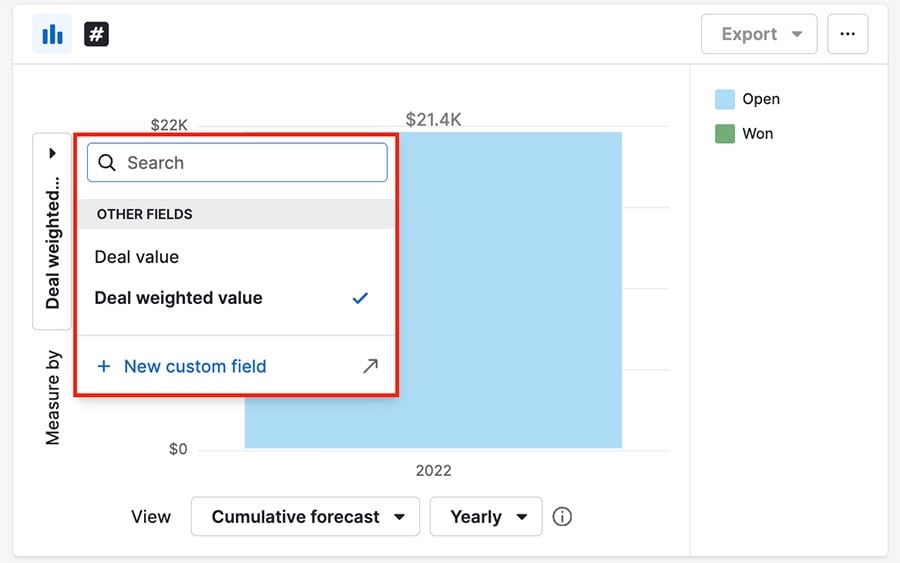
The measured by (Y-axis) option lets you choose between viewing your deal value, deal weighted value or a custom monetary field.
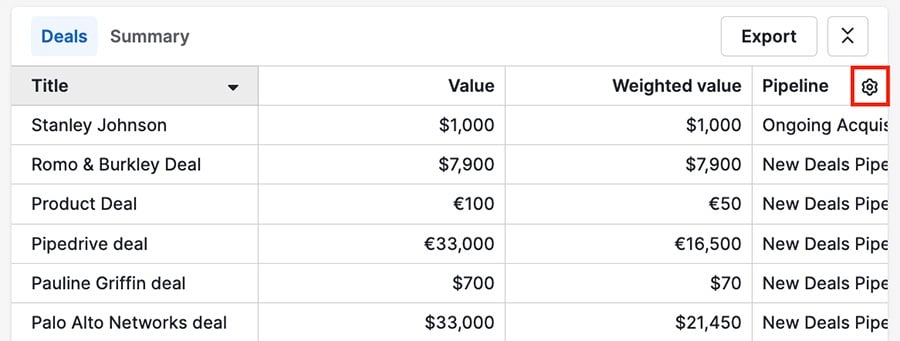
You can also change the visible fields in your table view by clicking the gear icon.
Was this article helpful?
Yes
No