Insights reports: deal duration
Pipedrive’s Insights deal duration report shows the average time it takes a deal to make it through your pipeline.
This information allows your team to identify where your sales are slowing down, enabling you to make improvements and accelerate your sales process.
Creating your deal duration report
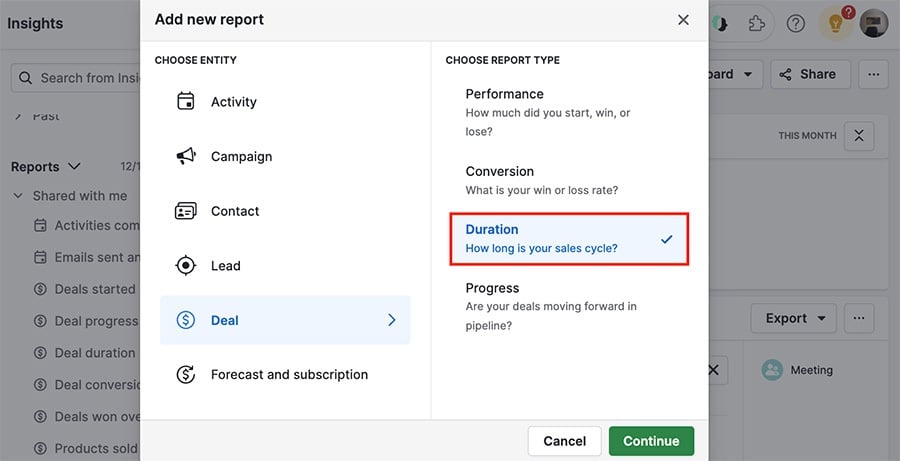
To create a deal duration report, go to Insights and click “+ Create” > Report > Deal > Duration.
Viewing your deal duration report
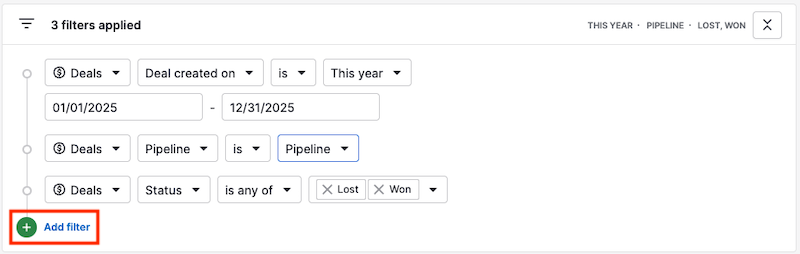
The duration report has the following filters by default.
- Deal created > is > this year
- Pipeline > is > [your default pipeline]
- Status > is any of > lost or won
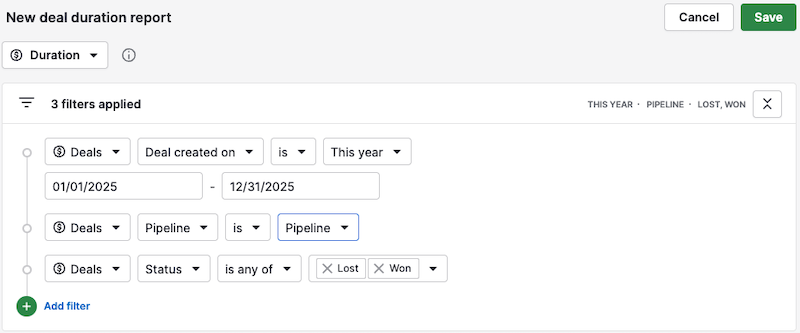
However, you can always adjust the filters to reflect the data you want to see.
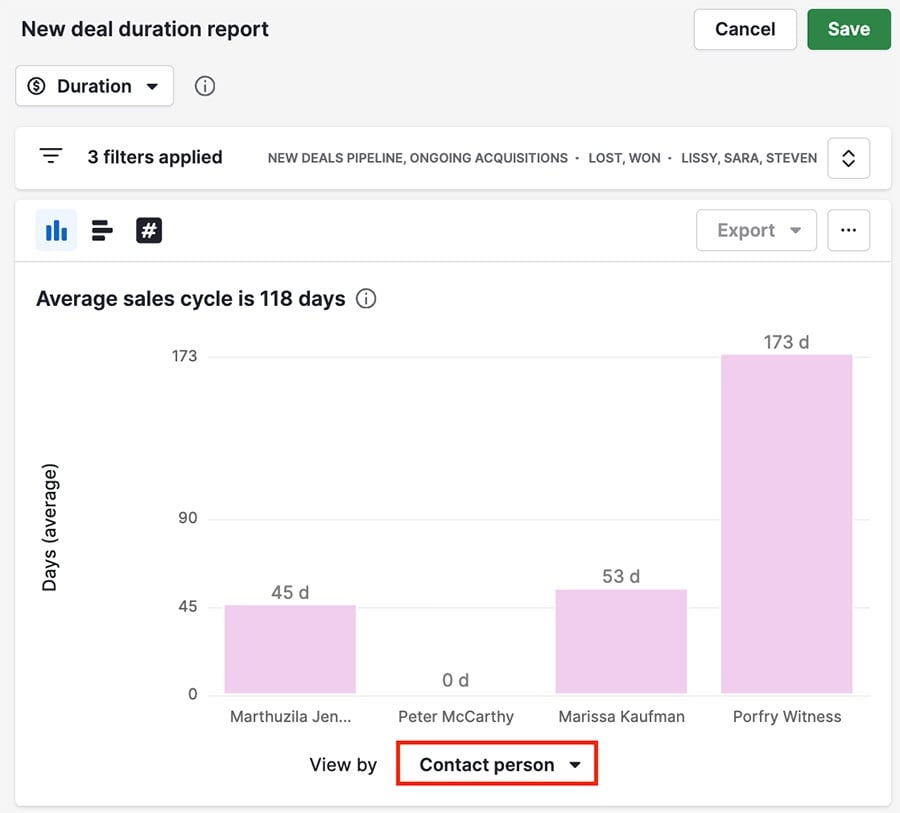
Average sales cycle
At the top of the report, you’ll see the average time it takes for a deal to go through your sales cycle.
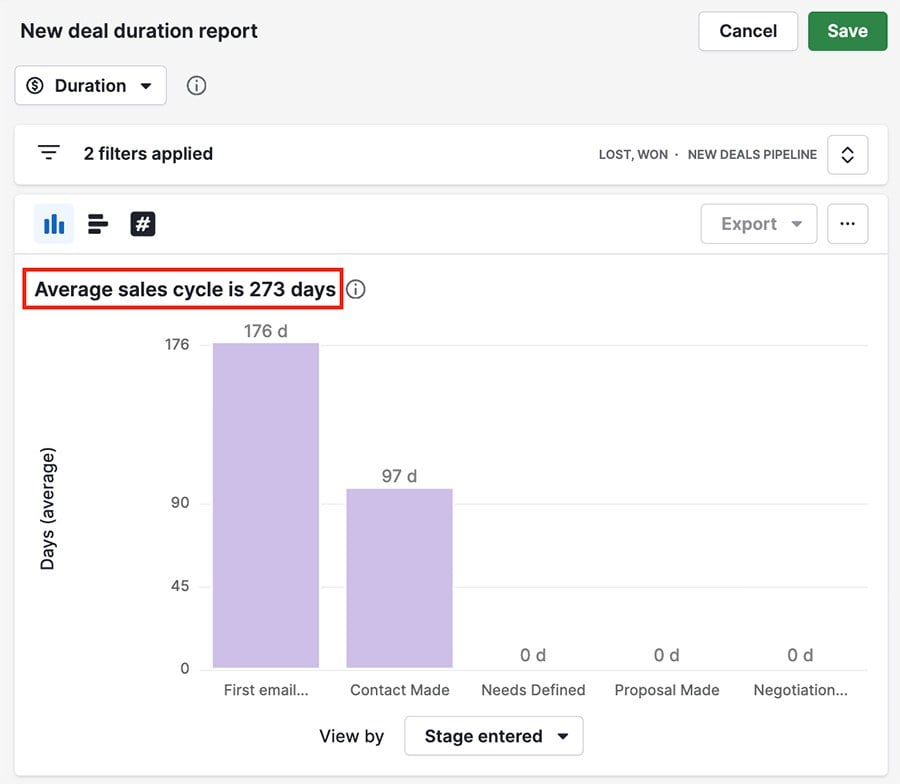
This number is calculated by dividing the total amount of time your deals have spent in all stages by the total number of deals generated by your filter.
Report columns
The columns in the report reflect the breakdown of your average sales cycle by days according to what you’ve selected to view on the X-axis.
By hovering over a column in the graph, you’ll see the number of deals contributing to each stage's average time.
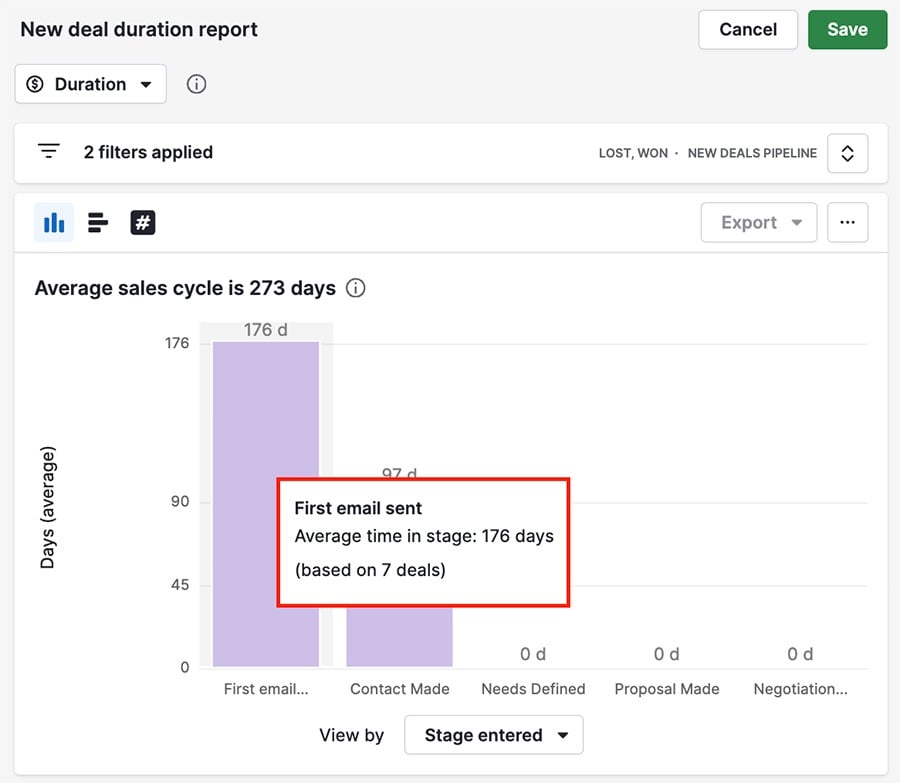
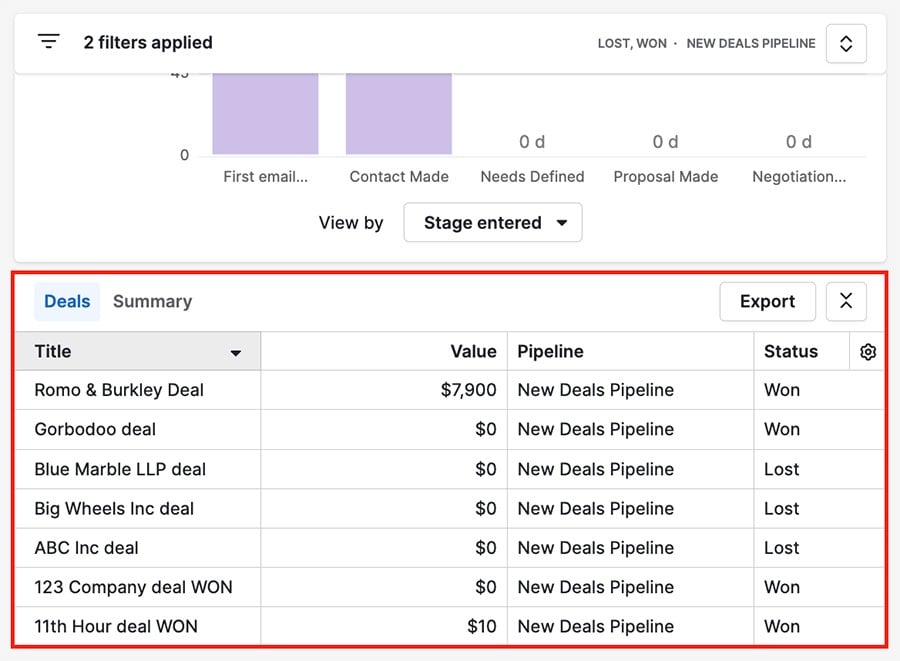
Table view
At the bottom of the page, you also have a table containing a breakdown of the deals displayed in the report along with the information from their respective fields.
Customizing your deal duration report
The data you see in your report can be adjusted using two different methods.
Filters
You can edit the existing filters or click “+ Add filter” to add another one.
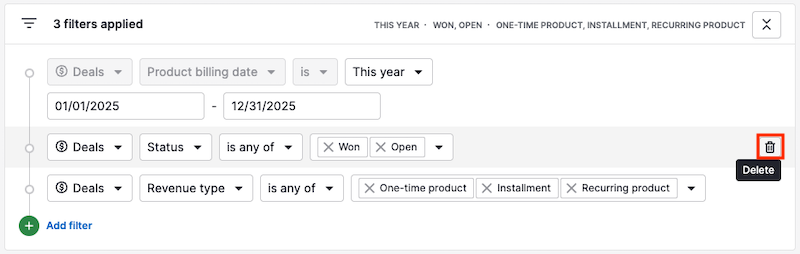
You can also hover your cursor over a filter and click the trash can icon to remove it.
Report columns
In your report, the view by option (X-axis) will have Stage entered selected by default, but you can choose to view your report by various default Pipedrive fields, as well as any custom fields of the following types:
- Users
- Date
- Single option
- Multiple option
- Organization
- Person
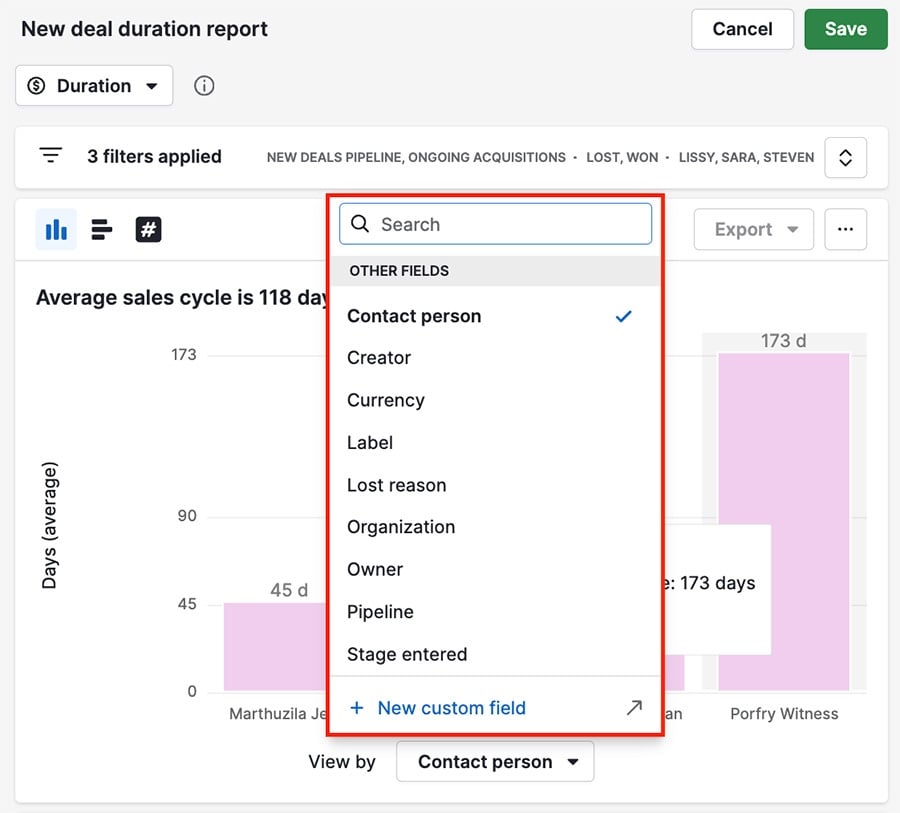
For example, here the report columns are being viewed by the linked contact person.
Once you’ve finished creating your report, you can add it to your dashboard or share it with your team.
Was this article helpful?
Yes
No