Insights feature
Keeping track of your progress is one of the most important parts of sales. The Insights feature in Pipedrive lets you create custom reports, dashboards and goals so you know exactly what you’ve accomplished so far and what still needs to be done.
There are three sections to the Insights feature:
- Reports – give a visual representation of data in your account based on selected filters
- Dashboards – display your reports and goals in one window, so you have all your desired Insights data in one place
- Goals – let you project your desired outcomes in a chart where you can see and track them

Where to find the Insights feature
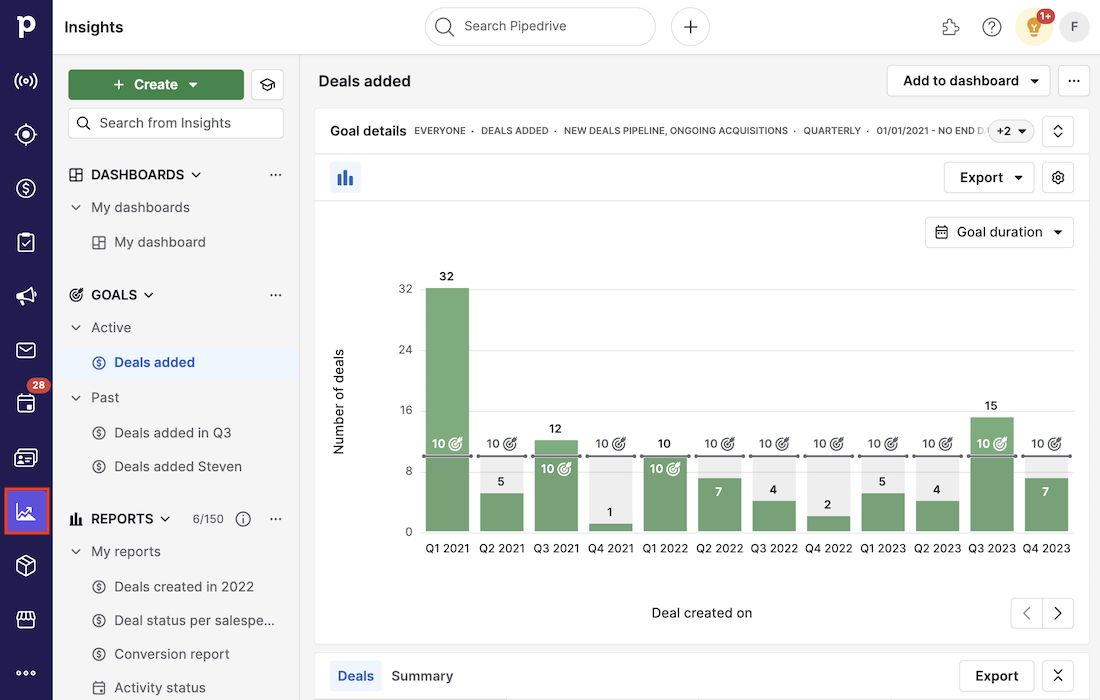
You can find the Insights feature by clicking its icon on the left-side toolbar.
Visibility and permissions
Users with deal admin access have full visibility of all deals and leads, regardless of the visibility group setting. Likewise, users with global admin access have full visibility of all person, organization and product data, regardless of the visibility group option.
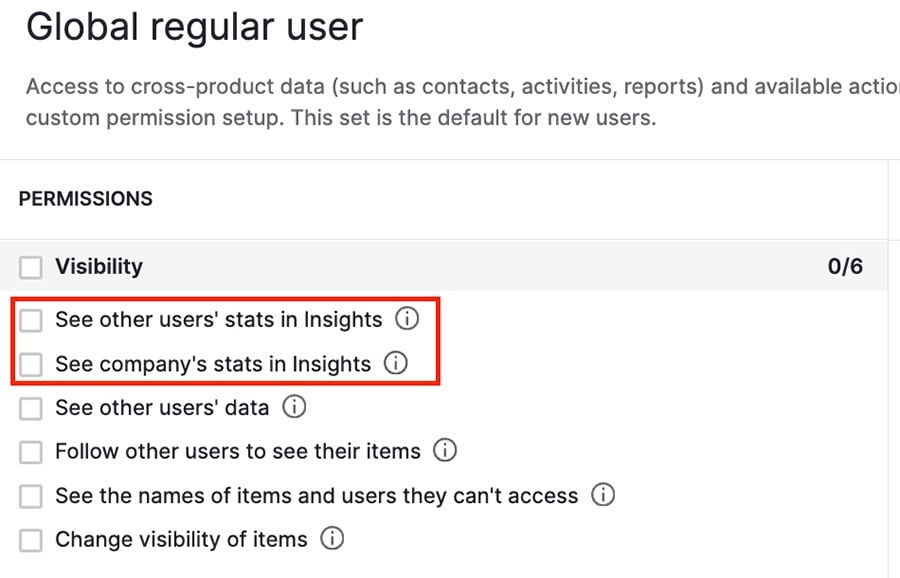
However, you can adjust the permissions for global regular users by going to Manage users > Permission sets > Global features permission sets.
- See company’s stats in Insights – Access the whole company’s stats in Insights, regardless of the user’s access to specific items. Requires “See other users’ data” to be enabled as well.
- See other users’ stats in Insights – Access to other users’ stats in Insights regardless of the user’s access to specific items. Requires “See other users’ data” and “See company’s stats in Insights” to be enabled as well.
Reports
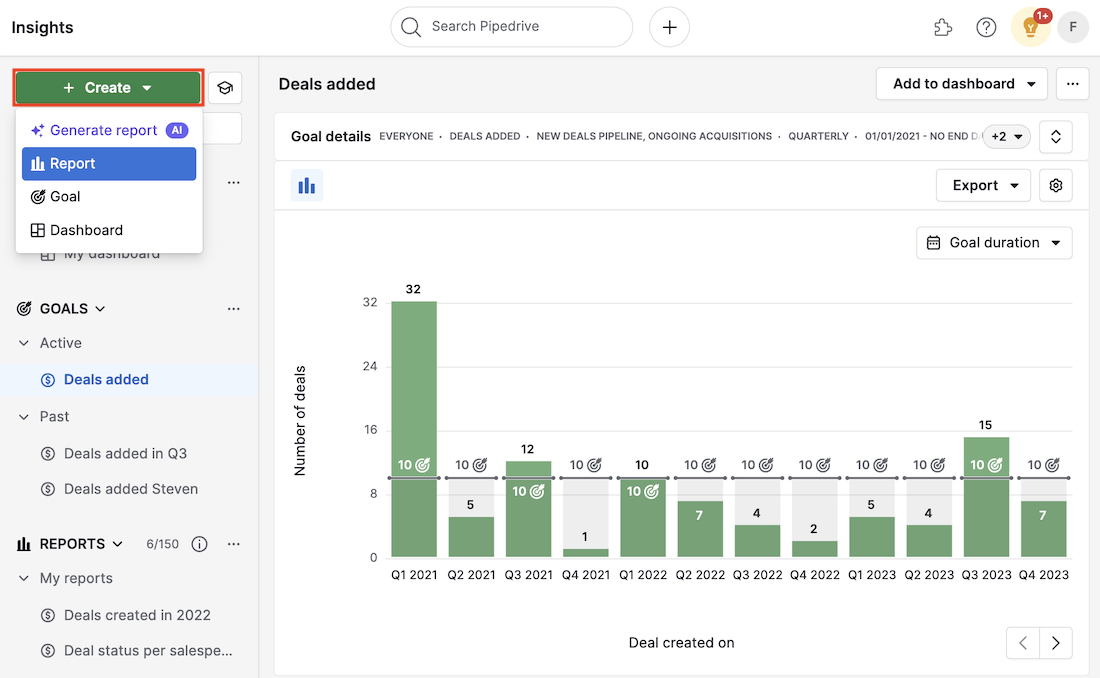
To create a report, go to Insights, click “+ Create” > Report and select one of the options there.
| Report name | Category | Minimum required plan |
| Activities performance | Activity | Lite |
| Emails performance | Activity | Lite |
| People | Contact | Lite |
| Organizations | Contact | Lite |
| Performance | Lead | Lite |
| Conversion | Lead | Lite |
| Performance | Deal | Lite |
| Conversion | Deal | Lite |
| Duration | Deal | Lite |
| Progress | Deal | Lite |
| Products | Deal | Lite |
| Product revenue forecast | Revenue forecast | Growth |
| Deal revenue forecast | Revenue forecast | Premium |
Learn more about sales forecasting
If you have the Campaigns add-on, you can also create the following reports:
- Campaigns conversion report – Measure the open, click, unsubscribe, delivery, bounce and spam rate of your marketing emails
- Campaigns performance report – See how many emails were sent, received, opened and clicked
Once you’ve created and customized your report, click the “Save” button in the top-right corner to name your report and add it to a dashboard.
Generating reports with AI
You also have the option to create reports with AI assistance.
There are two ways to do this: by clicking the “+ Create” button and then selecting “Generate report (AI),” or by clicking directly on “Generate report (AI)” at the top right of the screen.
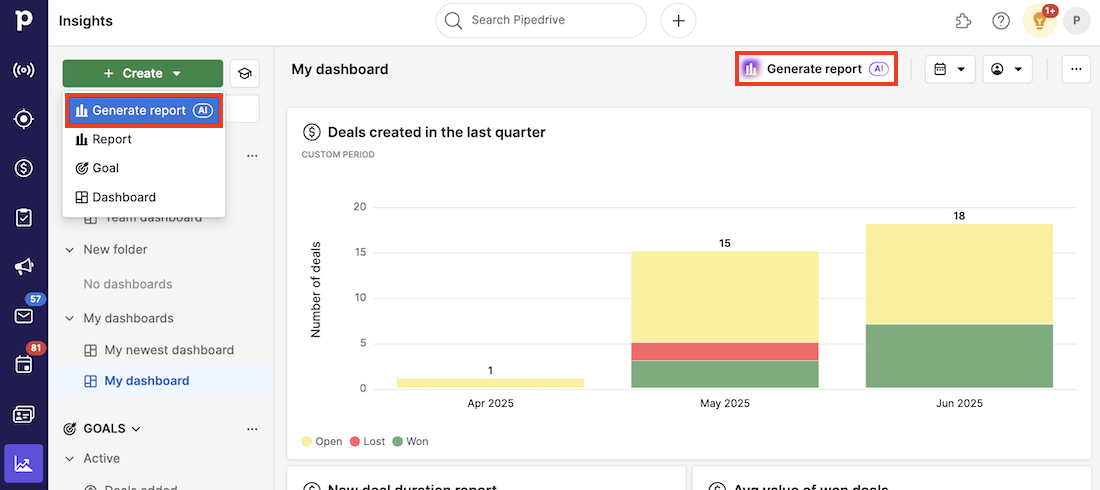
You‘ll then see a window where you can type your prompt to generate a report automatically, or choose one of the example prompts at the bottom.
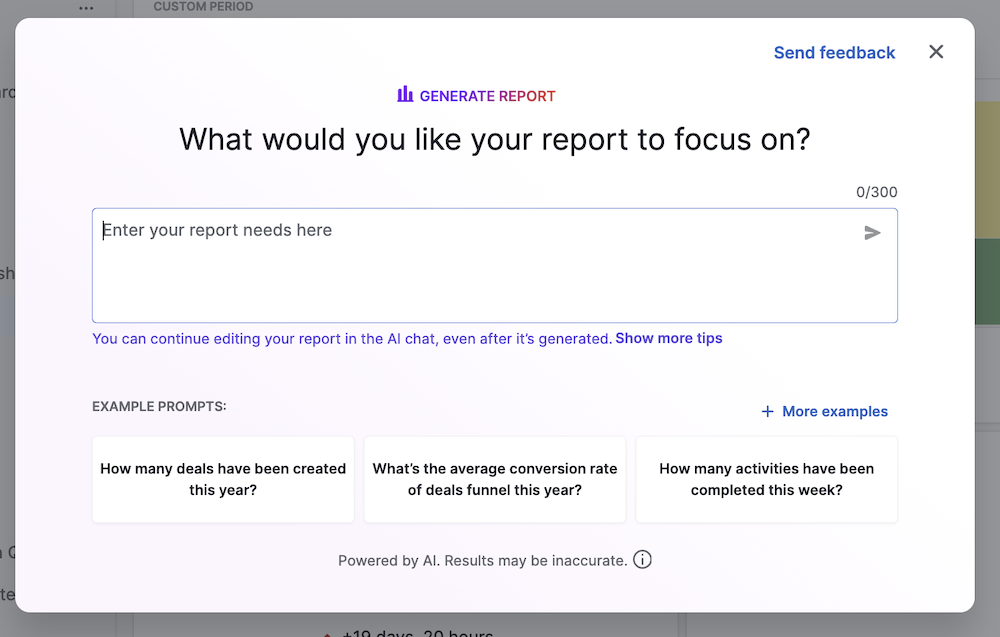
There‘s a dedicated article on AI report generation in Insights that you can read for more detailed information.
Supported fields
The supported deal default and custom fields in Insights are:
Deal field type | Filters | Visual Builder | Table |
User | ✔️ | ✔️ | ✔️ |
Person | ✔️ | ✔️ | ✔️ |
Organization | ✔️ | ✔️ | ✔️ |
Date | ✔️ | ✔️ | ✔️ |
Multiple options | ✔️ | ✔️ | ✔️ |
Single option | ✔️ | ✔️ | ✔️ |
Monetary (including weighted value, deal value and product value) | ⚠️ Only deal value is supported | ✔️ | ✔️ |
ID (team, pipeline, stage, status, lost reasons) | ✔️ | ✔️ | ✔️ |
| Numeric (including number of products) | ✔️ | ✔️ | ✔️ |
| Text | ✔️ | ✔️ | ✔️ |
| Large text | ✔️ | ✔️ | ✔️ |
| Autocomplete | ✔️ | ✔️ | ✔️ |
| Date range | ✔️ | ||
Time | ✔️ | ||
Time range | ✔️ | ||
Product | ✔️ View by: Title only Measure by: Product value, Number of products ⚠️ Not available in Segment by dropdown | ||
Address | ✔️ |
Filtering report information
You can use filters to see specific data in your account. You can mix different item fields within a filter to fully use the connections and custom fields you created in Pipedrive.
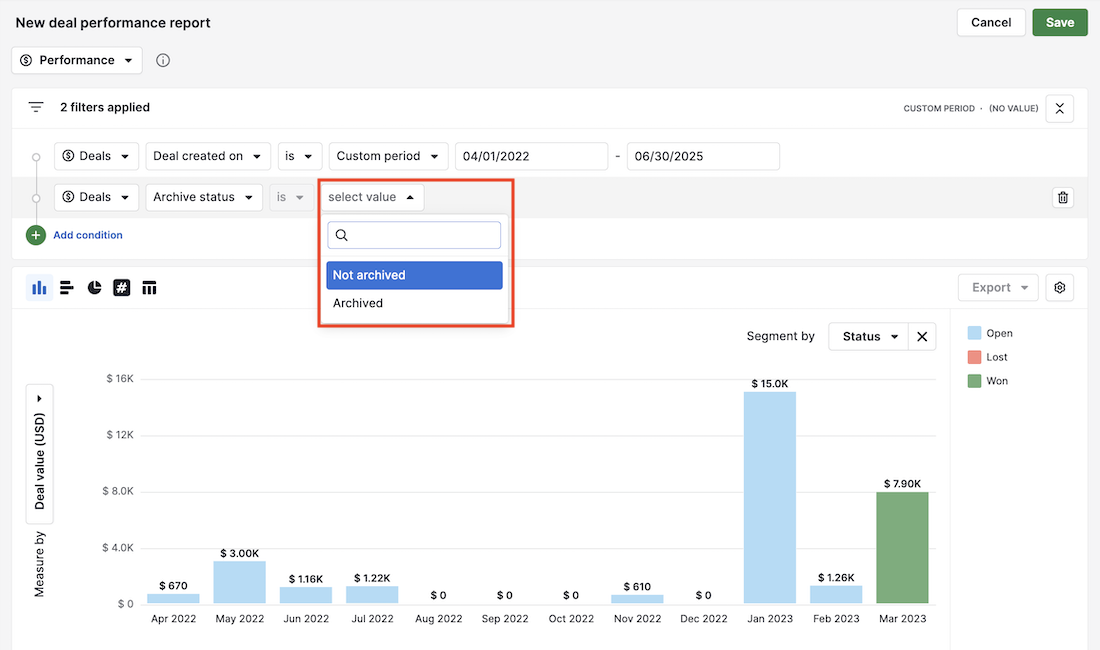
With the introduction of the option to archive deals and leads, you can now filter archived and non-archived deals and leads in Insights reports.
By default, both archived and non-archived data are included in the reports. If you’d like to exclude either type, use the available options to customize your view. You can also segment or view your data by status: archived or not archived.
Editing existing reports
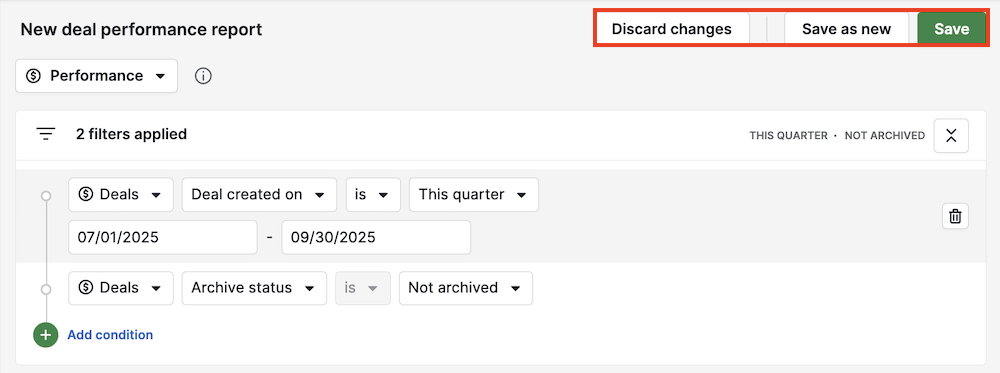
After you’ve created a report, you can go back in and make changes any time you want. After you’ve made your changes, you can either:
- Discard changes – reset the report back to the previous state
- Save as new – create a new report with the changes
- Save – save the changes to the existing report
To add an existing report to a dashboard, open the report, click “Add to dashboard” and select your desired dashboard.
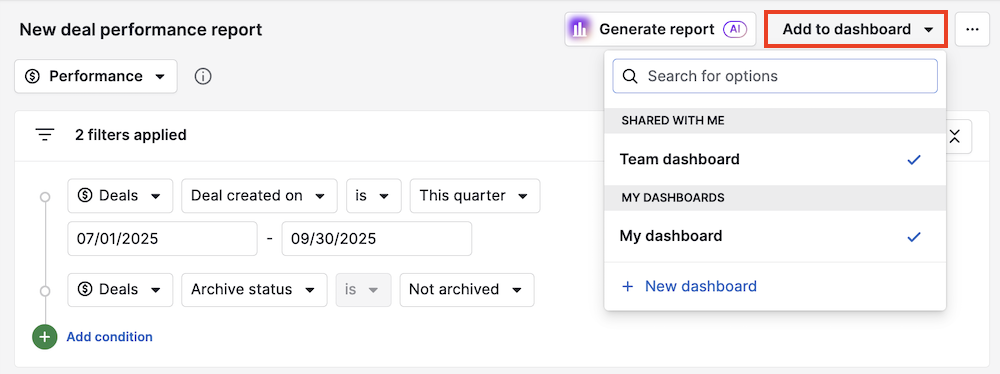
If you already added the report to a dashboard, you‘ll see a checkmark next to the dashboard name. Clicking it again will remove the report from the dashboard.
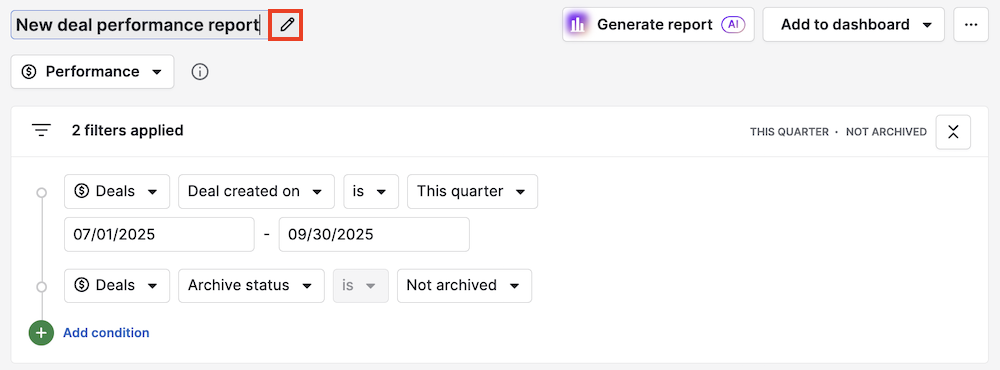
To rename your existing report, click on the report title to activate the edit mode. Then, hit enter on your keyboard to save the changes.
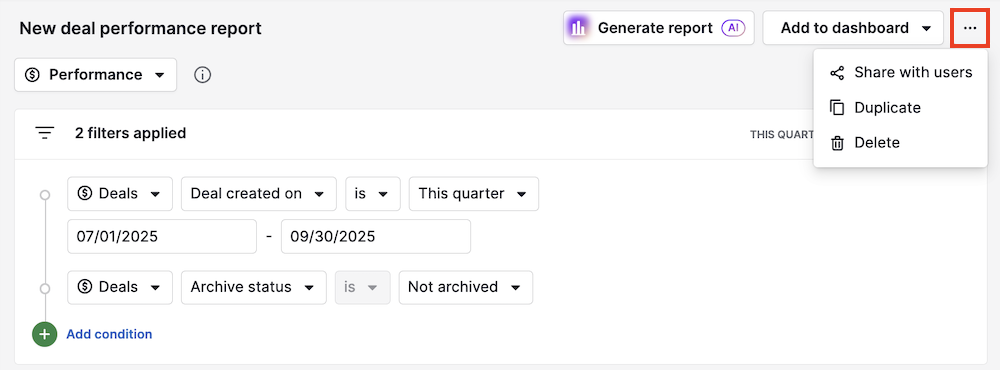
To delete, duplicate or share your existing report, click the “...” button and select the desired option.
Dashboards
If you want to add another dashboard, go to Insights and click ”+ Create” > Dashboard.
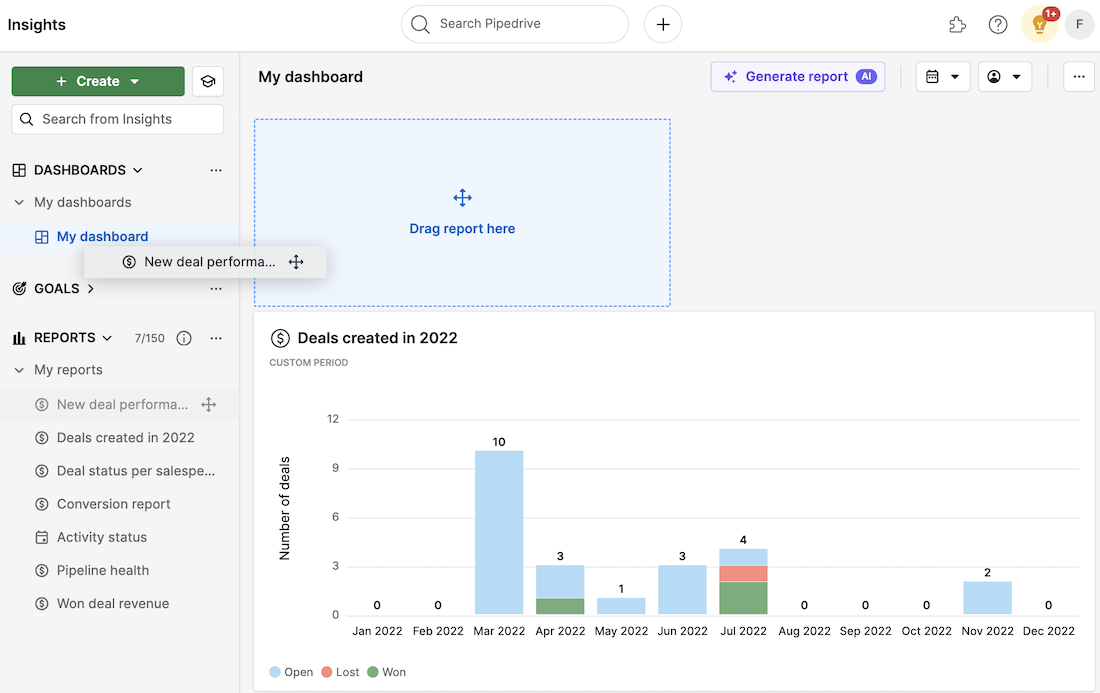
You can easily add custom reports to your dashboard by dragging a report from the Reports panel into any of your dashboards.
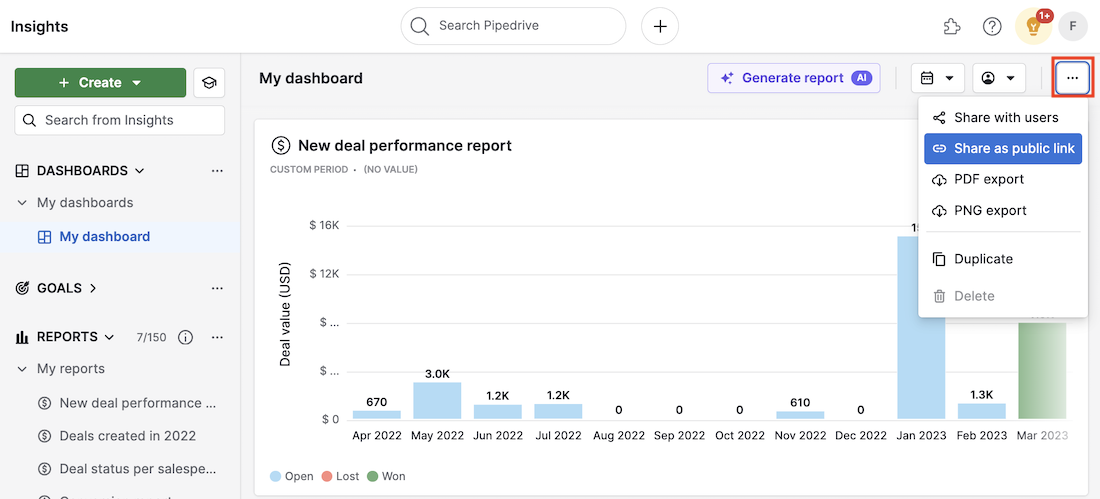
You can also share your dashboard with other Pipedrive users in your company, or with external people by sending them a shareable public link that grants view-only access to your dashboard.
Just click on the three dots on the top right, then “Share as public link”.
Goals
To create a new goal, go to your Insights, click ”+ Create” > Goal and choose one of the options available.
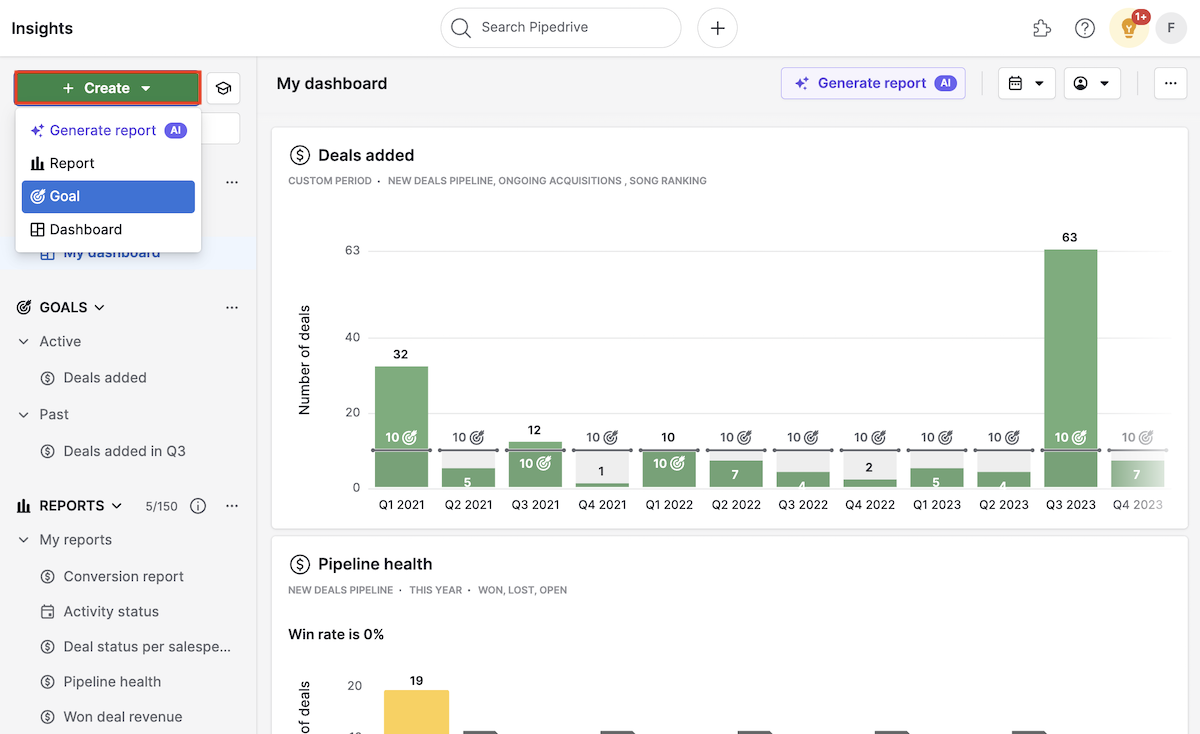
You can choose from any of the following options:
- Deal (Added, Progressed, Won)
- Activity (Added, Completed)
- Forecast (Revenue forecast)
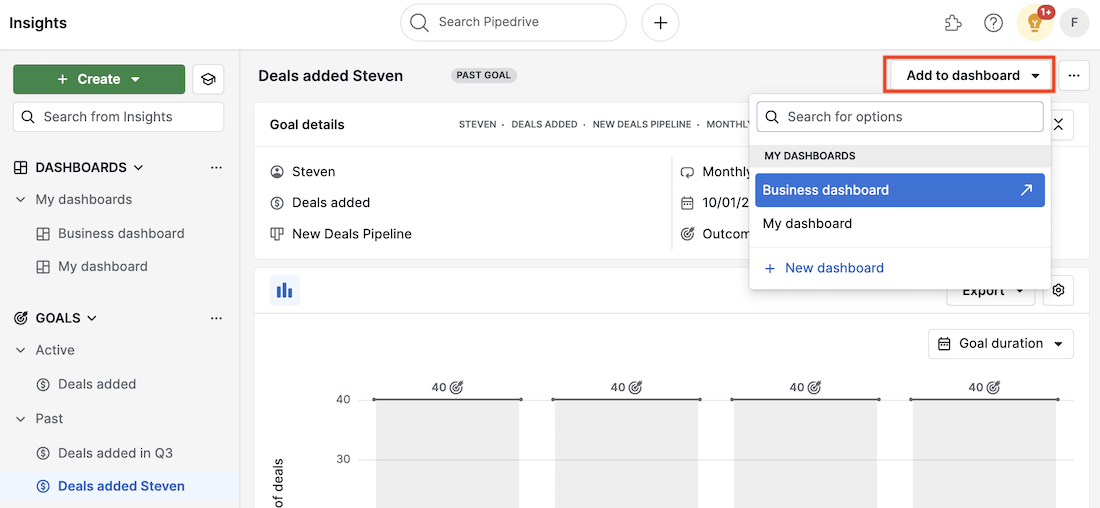
After you’ve saved your goal, you can add it to your dashboard by dragging it or clicking “Add to dashboard“ in the editor.
Was this article helpful?
Yes
No