Insights reports: lead conversion
The lead conversion report shows how many of your leads are converted into deals, helping you track performance and refine your conversion strategy.
You’ll see the lead-to-deal conversion rate, which helps to identify trends and optimize how you build relationships.

Creating a lead conversion report
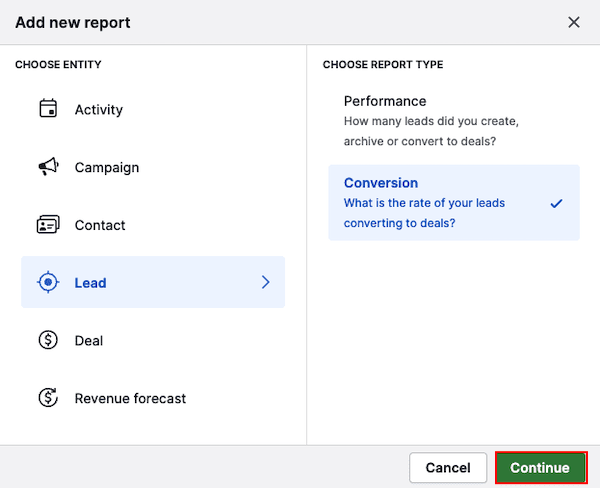
To create a report, open Insights and click “+ Create”.
Choose to either generate a report with AI or build one manually by selecting Report > Lead > Conversion, then click “Continue”.
Viewing your lead conversion report
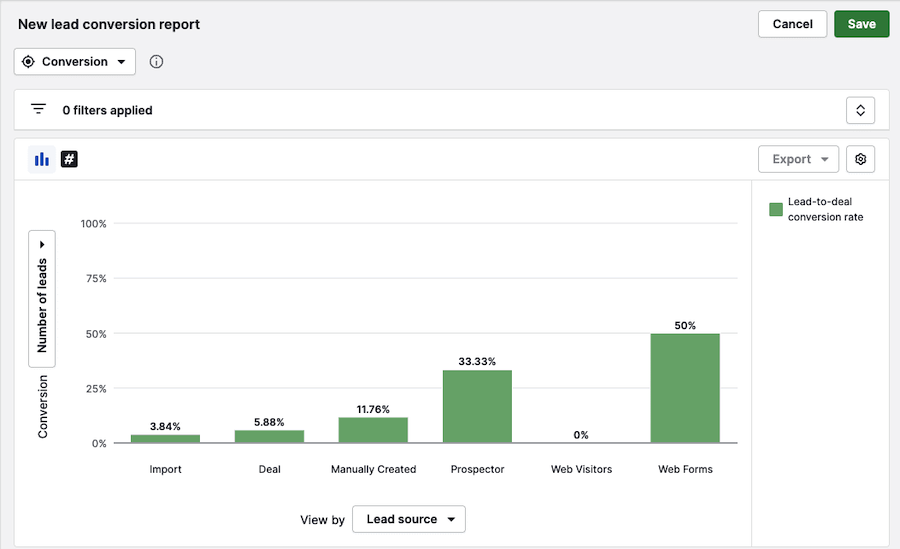
By default, the report shows your lead-to-deal conversion rate for leads created this year, grouped by lead source.
The conversion rate is calculated as: (converted leads × 100%) ÷ total leads.
You can view this data as a column chart or scorecard.
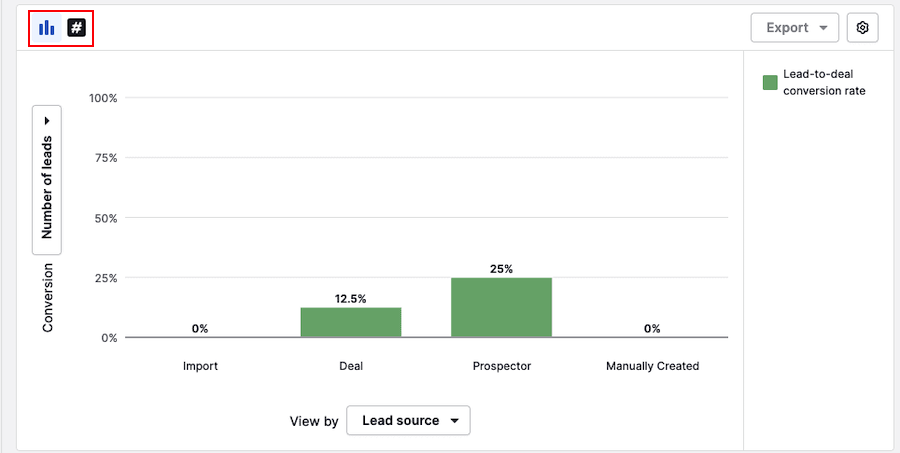
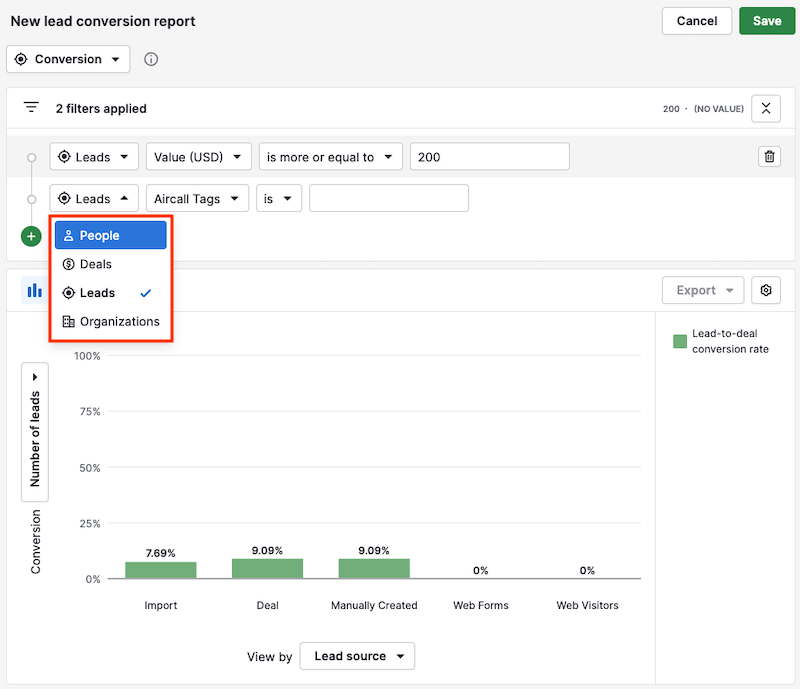
Column chart view
The columns represent the conversion percentage based on the selected view by field.
In this example:
- The Y-axis shows the percentage of your total leads that were converted
- The X-axis groups leads by their lead source (e.g., Import, Prospector, etc.)
Hover over a column to compare conversion rates. In this example, 17 leads came from deals and another 17 were added manually. Manual leads had a higher conversion rate, with two out of 17 converted to deals.
To see which leads were converted, click on a column and look for the lead status marked as converted to deal.
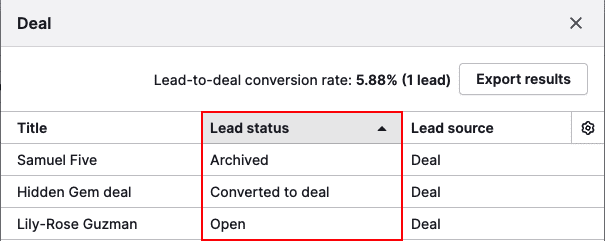
Scorecard view
This view offers a quick snapshot of your overall conversion rate, without breakdowns by source.
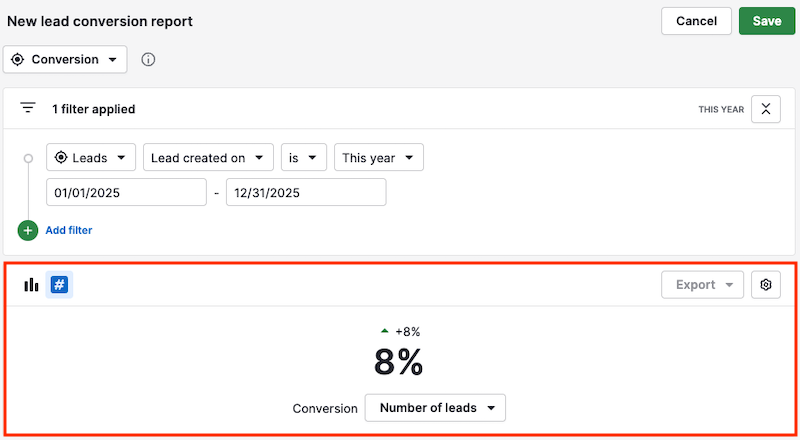
Click the percentage or check the table below to view the included leads.
Customizing your lead conversion report
Edit the default filter or click “+ Add filter” to apply additional filters. You can also use combined data to filter by deal, person and organization.
You can customize the conversion metric with the following fields:
- Lead value (converted to default currency)
- Number of leads
- Custom fields (numerical/monetary)
To segment your data further in the column chart view, click on the field name next to View by metric.
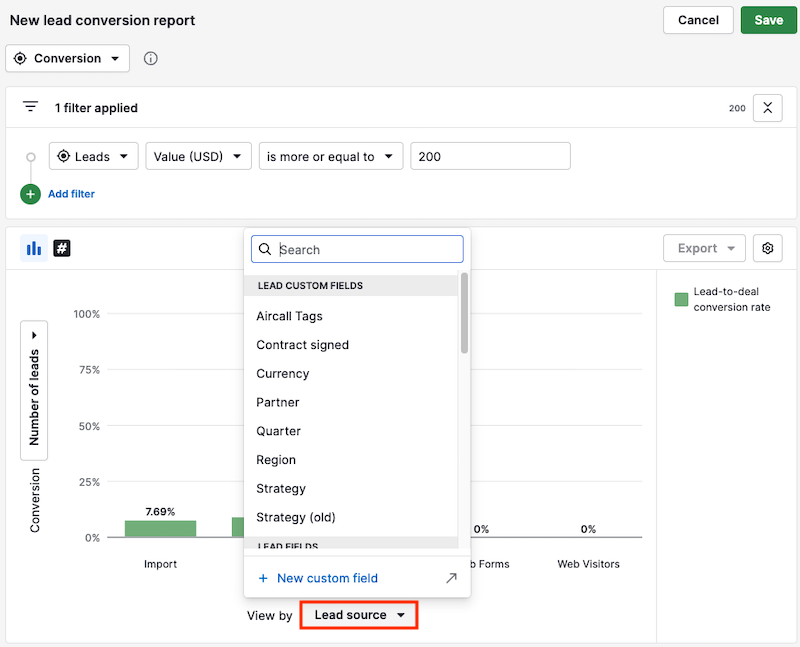
You can choose from the following fields:
| Date fields | Lead fields | Lead custom fields |
|---|---|---|
| Archive time | Contact person | Custom date |
| Convert time | Creator | Custom multiple options |
| Lead created on | Currency | Custom organization |
| Next activity date | Label | Custom person |
| Update time | Lead source | Custom single option |
| Lead status | Custom user | |
| Organization | ||
| Owner | ||
| Owner status | ||
| Source channel | ||
| Source channel ID | ||
| Source origin | ||
| Team | ||
| Title |
Once you finish setting up your report, click “Save”. You can also add it to a dashboard and share it with your team.
Was this article helpful?
Yes
No