Insights reports: activities performance
The activities performance report in Insights tracks the completion of your team’s activities, like calls, meetings and tasks, to help you monitor daily progress and productivity.
You can see metrics by activity type, status and user performance, giving you a clear view of what’s getting done and where follow-ups may be needed.
Creating your activities performance report
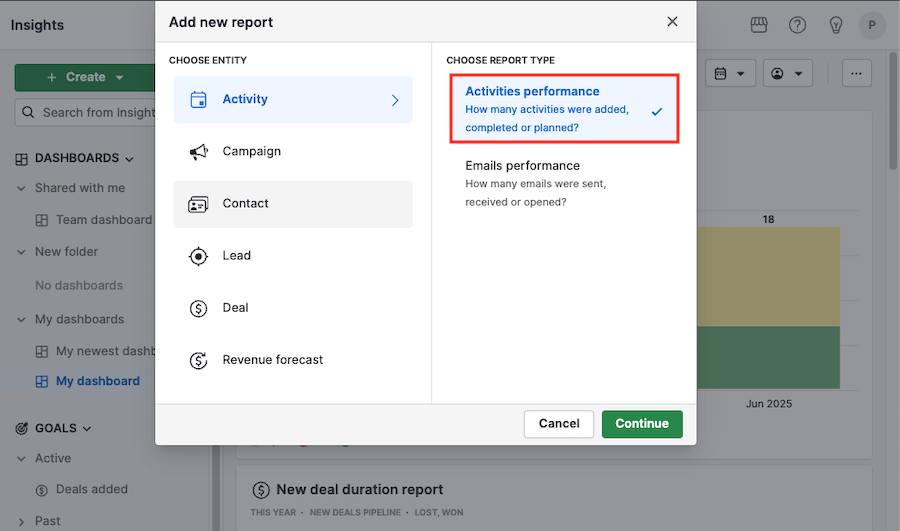
To create an activities performance report, go to Insights and click “+ Create” > Report > Activity > Activities performance.
Viewing your activities performance report
There are three sections in your performance report that allow you to view your data.
Filter view
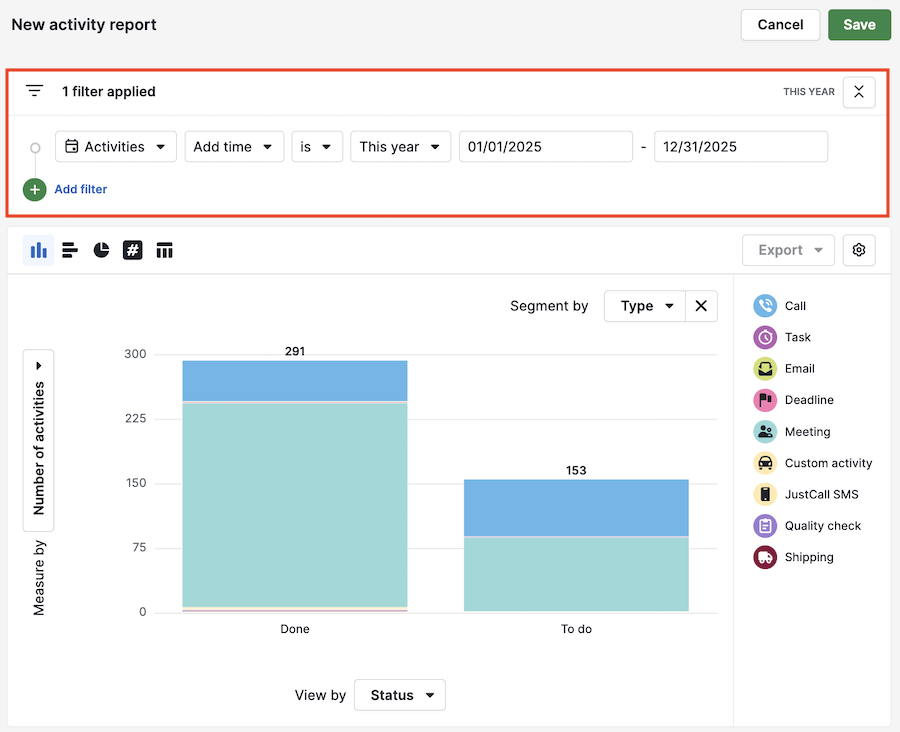
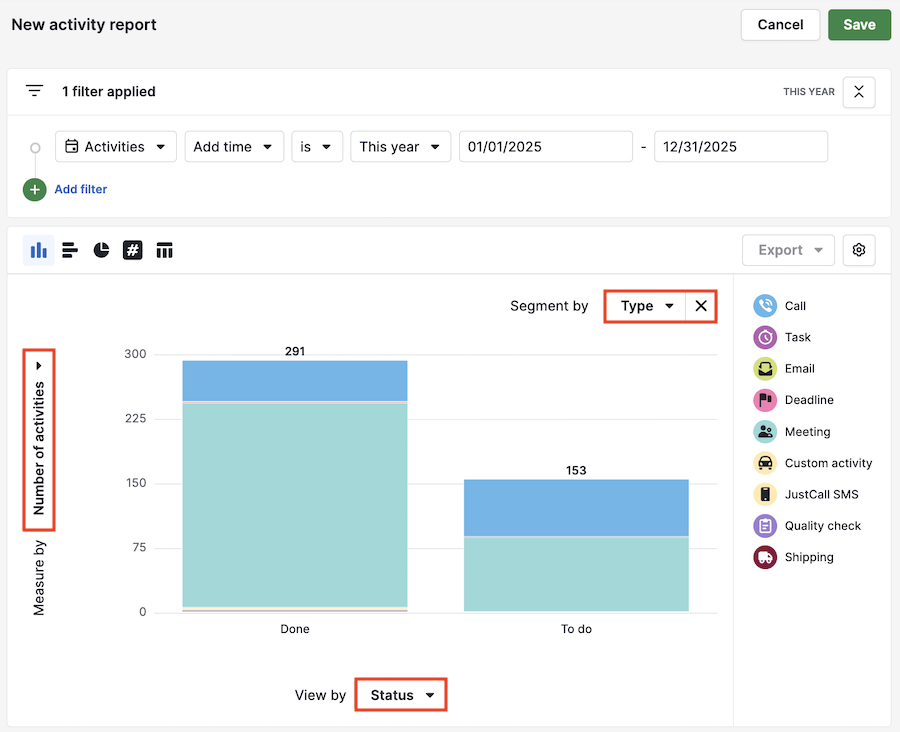
The default filter for your activities performance report is Add time > is > this month, but filters can be added or edited.
For example, here the filter has been changed to show all activities added this year.
Visual builder
Here you can see your data visualized through charts.

Hover your cursor over any column in your chart to see an overview of the data contained there.
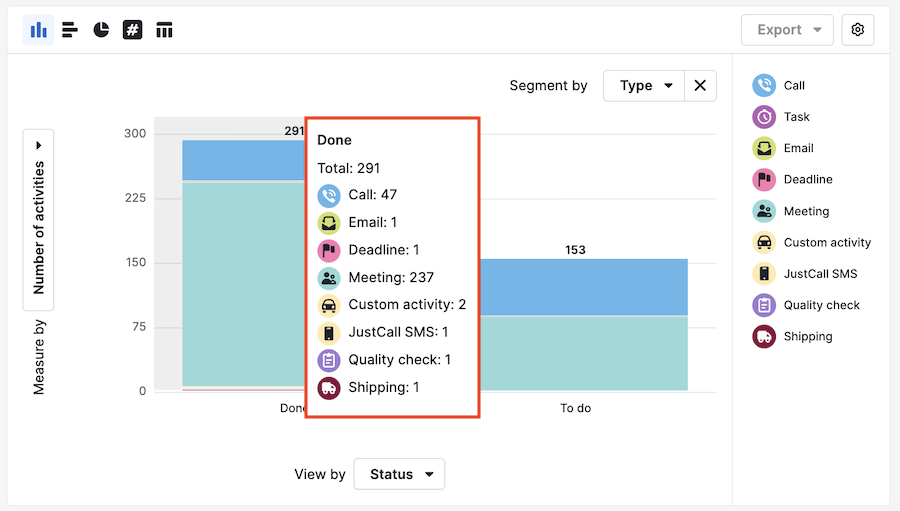
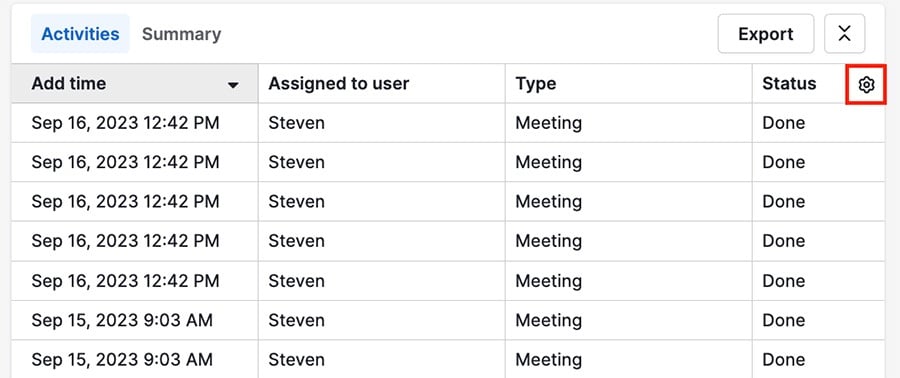
Table view
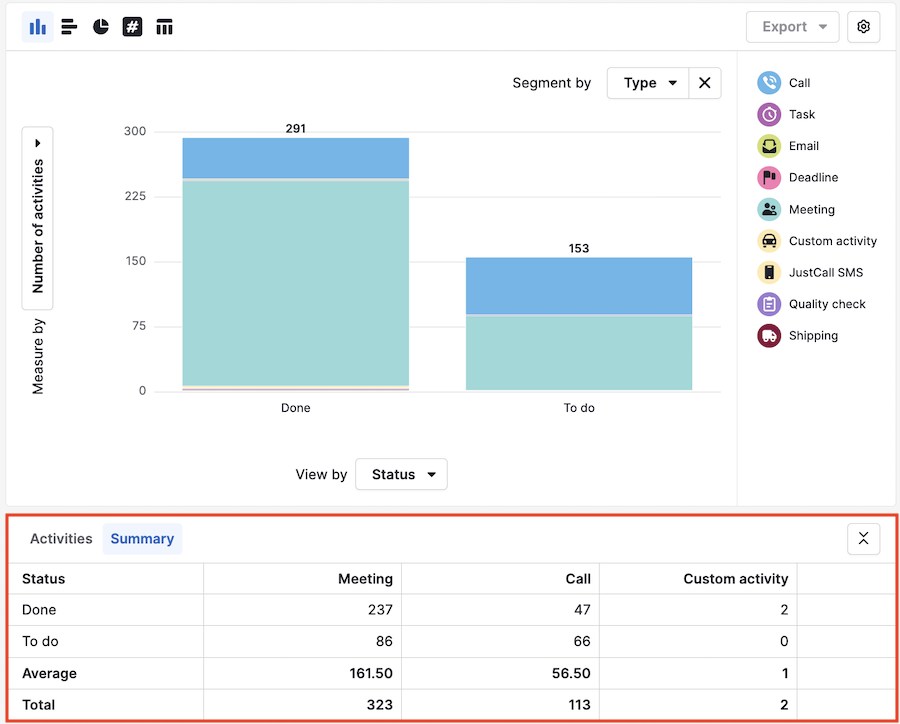
At the bottom of the page is the table view, where you can see your data in a spreadsheet format, or click “Summary” for a general overview of the data in your report.
Customizing your activities performance report
Each section of your activities performance report can be customized to show the exact data you’re looking for.
Filter view
You can add filters to your report by clicking “+ Add filter” or remove a filter by hovering your cursor over it and clicking the trash can icon.

Visual builder
You can use the view by, measure by and segment by fields to change the way your data is visualized.
You can also change the number of visible columns, as well as their colors, by clicking the gear icon in the top right corner.
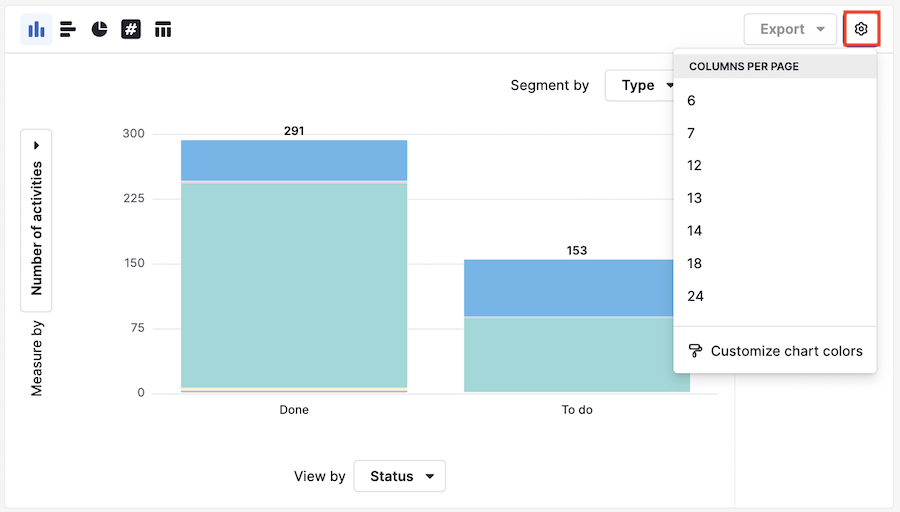
Table view
To change the visible columns in your table view, click the gear icon in the top-right corner.
Supported activity fields
Here are the supported activity fields for activities performance reports.
Activity type | Filters | Visual Builder | Table |
Duration (minutes) | ✔️ | ✔️ | ✔️ |
Number of activities | ✔️ | ||
Pipeline | ✔️ | ✔️ | |
Team | ✔️ | ✔️ | ✔️ |
Add time | ✔️ | ✔️ | ✔️ |
Due time | ✔️ | ✔️ | ✔️ |
Last notification time | ✔️ | ✔️ | |
Marked as done time | ✔️ | ✔️ | ✔️ |
Update time | ✔️ | ✔️ | |
Assigned to user | ✔️ | ✔️ | ✔️ |
Creator | ✔️ | ✔️ | ✔️ |
Type of activity | ✔️ | ✔️ | ✔️ |
Free/Busy | ✔️ | ✔️ | ✔️ |
Deal | ✔️ | ✔️ | ✔️ |
Contact person | ✔️ | ✔️ | ✔️ |
Organization | ✔️ | ✔️ | ✔️ |
| Subject | ✔️ | ✔️ | ✔️ |
Status | ✔️ | ✔️ | |
ID | ✔️ |
Was this article helpful?
Yes
No