Insights reports: deal conversion
The deal conversion report in Insights shows how often your deals are won or lost, helping you identify strengths and areas for improvement in your sales process.
Create a deal conversion report
To create this report, open Insights and click ”+ Create“.
You can either generate a report with AI or create one manually by selecting Report > Deal > Conversion, then clicking “Continue”.
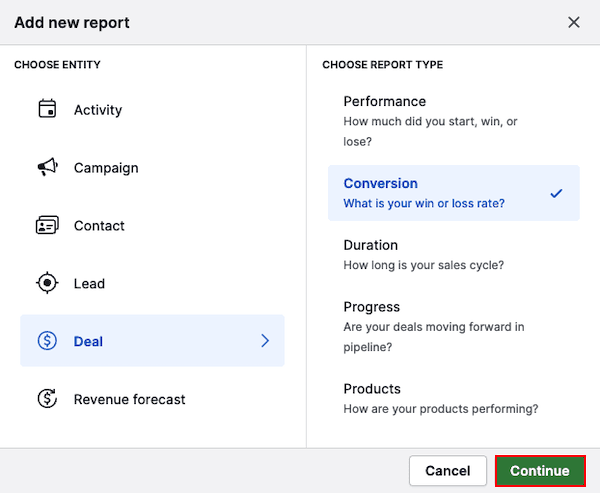
Deal conversion report types
There are two types of conversion reports you can create:
- Funnel conversion
- Win/loss conversion

Choose whether to analyze conversion through the pipeline or by win/loss outcome.
| Report type | Funnel conversion | Win/loss conversion |
|---|---|---|
| Purpose | Shows deal conversion between pipeline stages | Compares total deals won vs lost |
| Default filters | Pipeline Deal created = this year Status = Won/Lost |
Deal created = this year Status = Won/Lost |
| View by (X-axis) | Pipeline stages | Date fields Deal fields Deal custom fields |
| Measure by (Y-axis) | Number of deals Deal value Weighted value Custom numerical field Custom monetary field |
|
Funnel conversion report
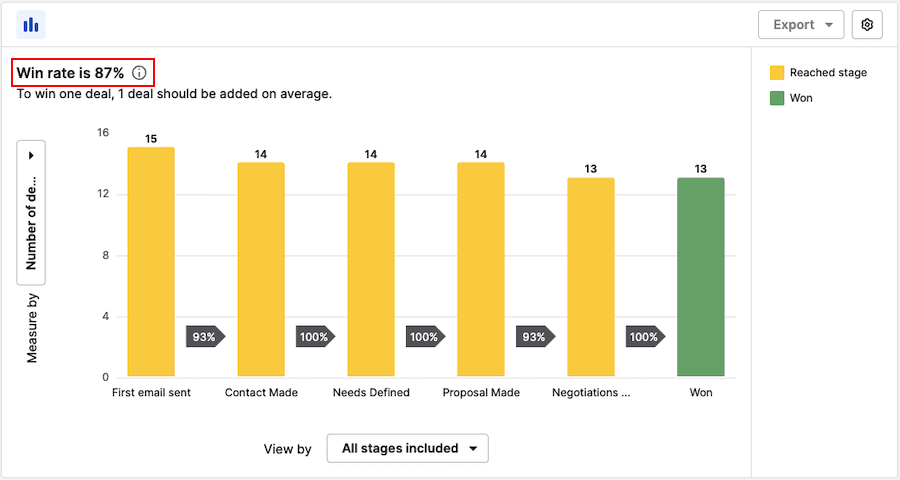
The funnel report shows your conversion rate between pipeline stages.
By default, the report filters conversion data for deals created this year in a specific pipeline that were either marked as:
- Won – deals considered to have completed every stage in your pipeline, no matter where they were closed
- Lost – deals that stopped at a specific stage in the pipeline
Each column in the chart represents a pipeline stage and shows the percentage of deals that reached it. Your overall win rate appears at the top.
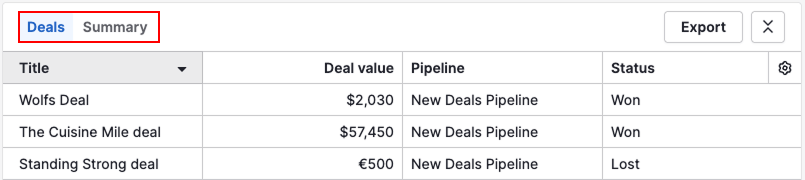
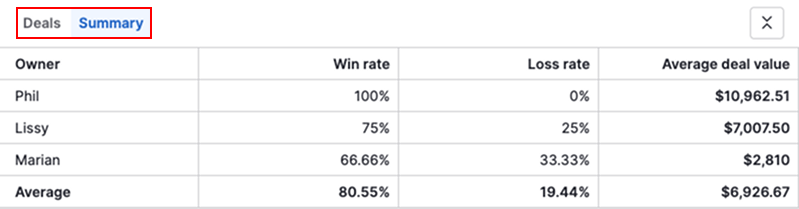
Below the chart, you’ll see a table view with two tabs:
- Deals: Detailed list of filtered deals
- Summary: Aggregated results by pipeline stage
How to customize your report
Edit filters
Edit the filters to include fields from people, deals and organization entities.
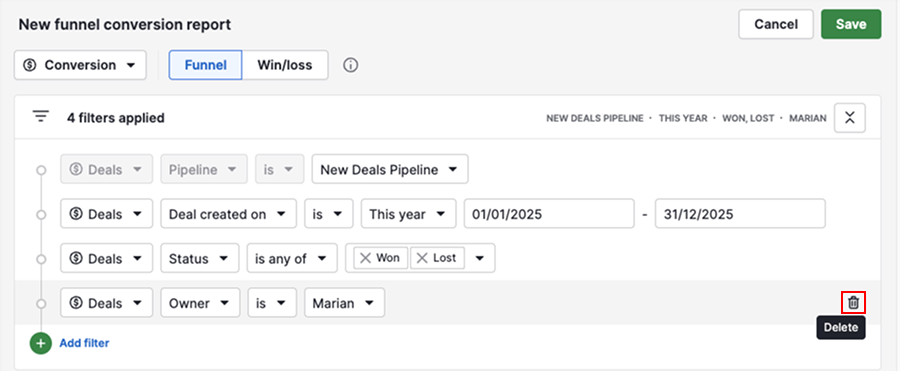
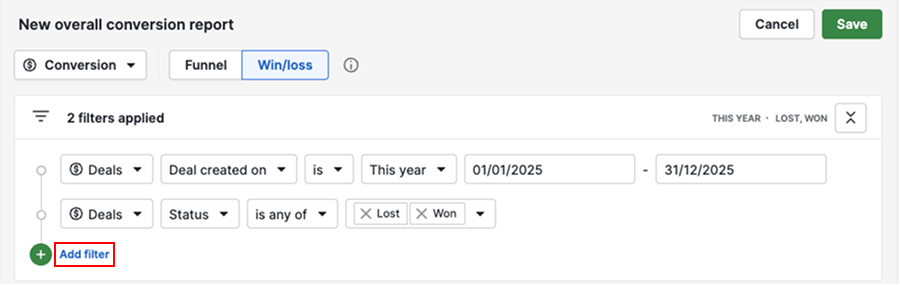
To add more filters, click “Add filter”.
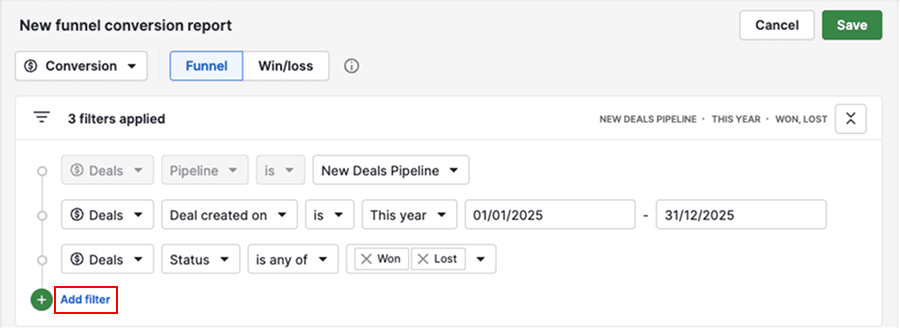
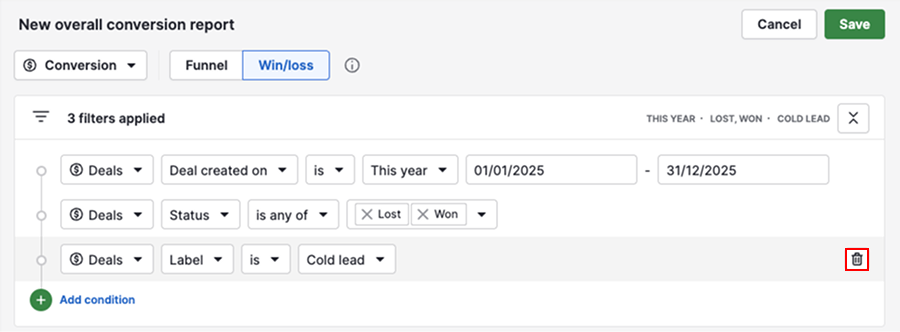
To delete unnecessary filters, hover over them and click the trash can icon.
Adjust visual builder
By default, the “View by” displays all pipeline stages. Click on a stage name to remove it.
The “Measure by” is editable and uses the same options available in all deal conversion reports.

Once ready with the report, click “Save”. You can then also add it to a dashboard or share it with your team.
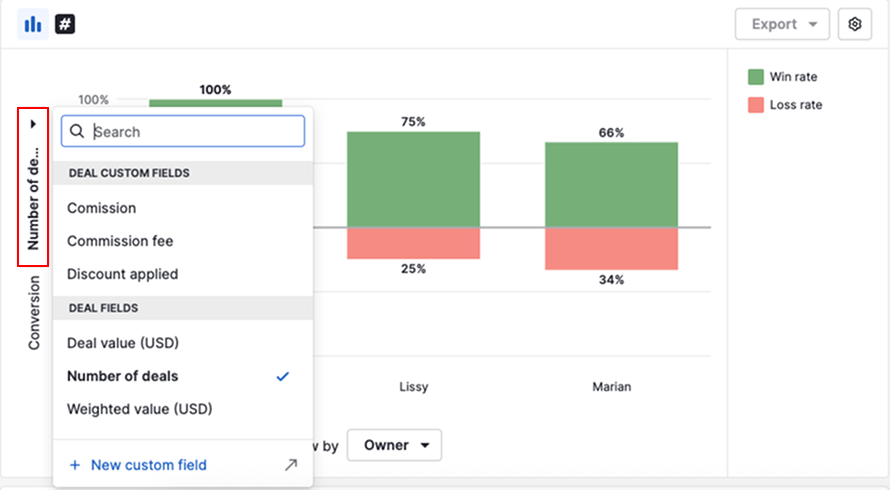
Win/loss conversion report
This report displays your overall win and loss rates.
With default filters applied, you’re looking at deals created this year that were either won or lost.
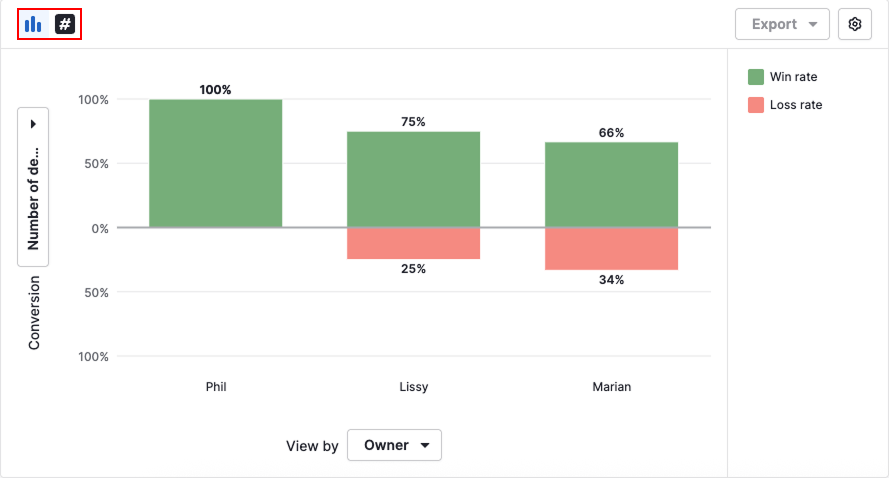
The columns in the chart represent deal owners, and the percentages indicate the number of deals won or lost during the year. Hover over a column to see the exact number of deals won and lost.
In the table view, you can switch between:
- Deals: Detailed list of deals shown in the chart
- Summary: Aggregated results based on the view by field used in the chart. By default, you’ll see the deal owner.
How to customize your report
Edit filters
You can edit filters to combine data from people, deals and organization entities. To add more filters, click “Add filter”.
To delete a filter, hover over it and click the trash can icon.
Adjust visual builder
You can choose from two chart types: column chart or scorecard.
In column charts, the “View by” setting lets you group data by different field types:
- Date fields – such as archive time, close time, deal creation time and last stage change
- Deal fields – like owner, pipeline, source channel, contact person or label
- Deal custom fields – includes any date, multiple options, single option, organization, person and user fields
Use the same “Measure by” options as in the funnel conversion report to define your Y-axis.
When you’re done, click “Save”. You can then add the report to a dashboard or share it with your team.
Was this article helpful?
Yes
No