Knowledge Base

Knowledge Base/Progress/Insights reports/Insights reports: dea...

Topics
Creating your progress report
Viewing your progress report
Customizing your progress report

Insights reports: deal progress

JT
Jenny Takahara, June 13, 2022
Note: The number of Insights reports you can have depends on which plan you are on. You can learn more about usage limits in this article.

The Insights deal progress report will give you the ability to see the deal advancement through stages in the time frame specified, so you can see how well your deals have been progressing through your sales cycle.


Creating your progress report

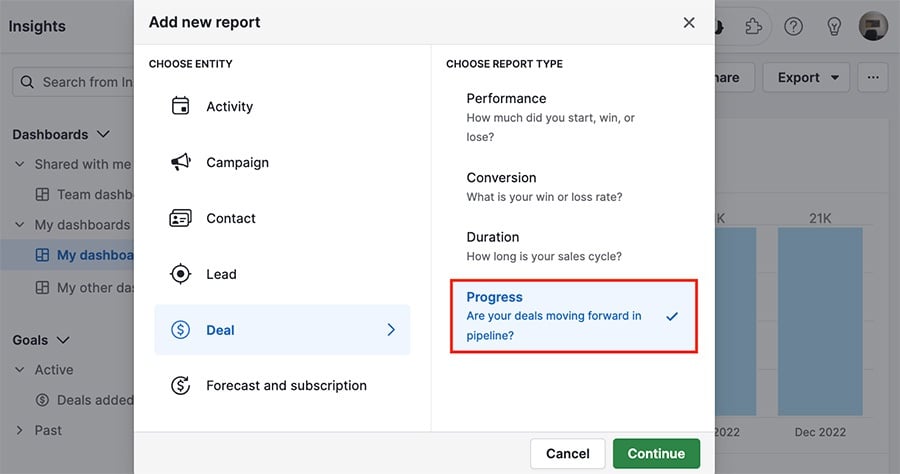
To create a deal progress report, go to the Progress tab > Insights, click the plus "+" sign next to the search bar, then Report > Deal > Progress.


Viewing your progress report

Note: Only the most recent stage progression is shown in this report. For example, if a deal has entered Stage 2 and is later moved back to the previous stage called Stage 1, then that deal will not be shown in the progress report for Stage 2. In addition, the timestamp which indicates the time when the deal entered Stage 1 will be the time when the deal moved back to Stage 1, not when it initially entered Stage 1.


The progress report will default to the following filters:

  • Date of entering stage is This year
  • Pipeline is (your default pipeline)


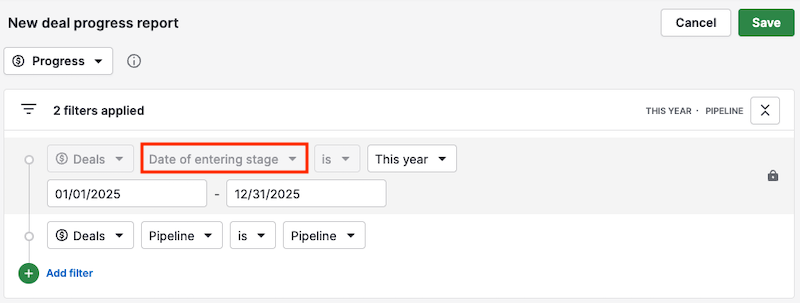
You can always adjust or add filters according to the data you want to see. The Date of entering stage condition will be locked in since it is the default field needed to assess deal progress.

Screen_Shot_2020-04-20_at_3.37.55_PM.png


How is deal progress measured?
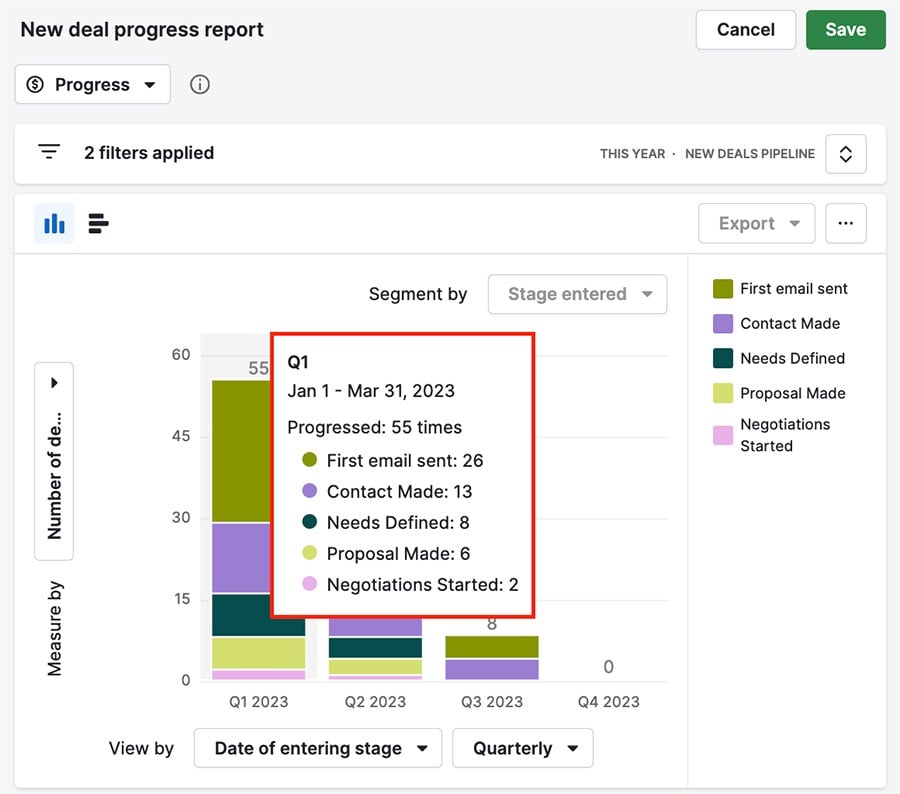
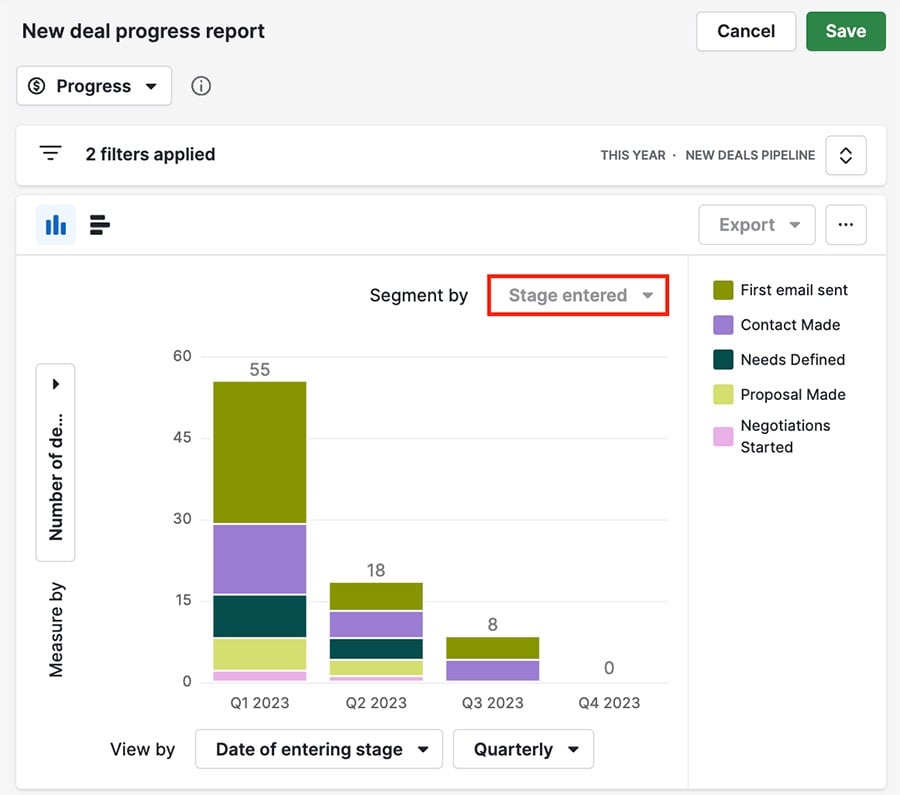
Note: Winning a deal will not affect deal progress report results in the stages that were skipped.

If you choose to measure by the number of deals, you will see the number of deals that have entered each stage in the timeframe selected. Other deal progress measures such as deal value and deal weighted value can also be selected. Hovering over each column will show the breakdown of the field you have chosen to segment by.

The entered stage deal count will also include deals that have skipped that stage while moving on to a future stage. For example, if one deal has moved from stage two directly to stage five in the time frame selected, it will show as having entered stages three, four and five.


Customizing your progress report

Insights reporting offers a lot of flexibility in customizing your reports to reflect the data you want to see. The progress report will always show you the stage entered field since it's important to know where your deals advance to, but you can group how you want to view this data in a number of ways.


Measure by (y-axis)

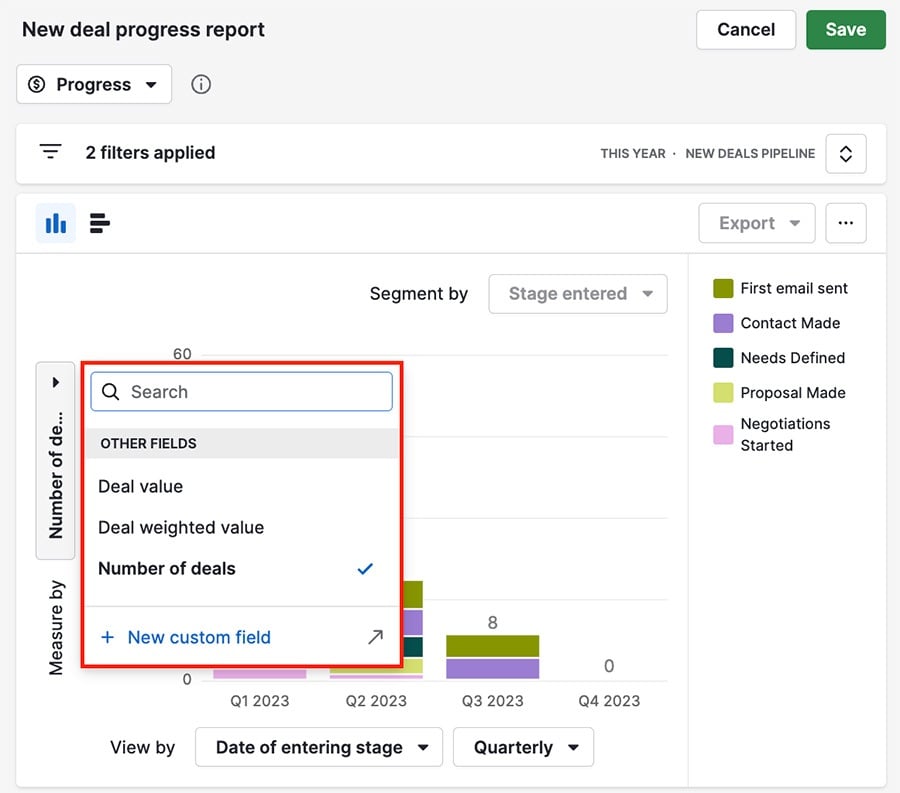
You can choose the field you want to measure your deals by on the left-hand side of the chart.

  • Deal value
  • Deal weighted value
  • Number of deals
  • Number of products
  • Product value
  • Any numerical or monetary custom fields
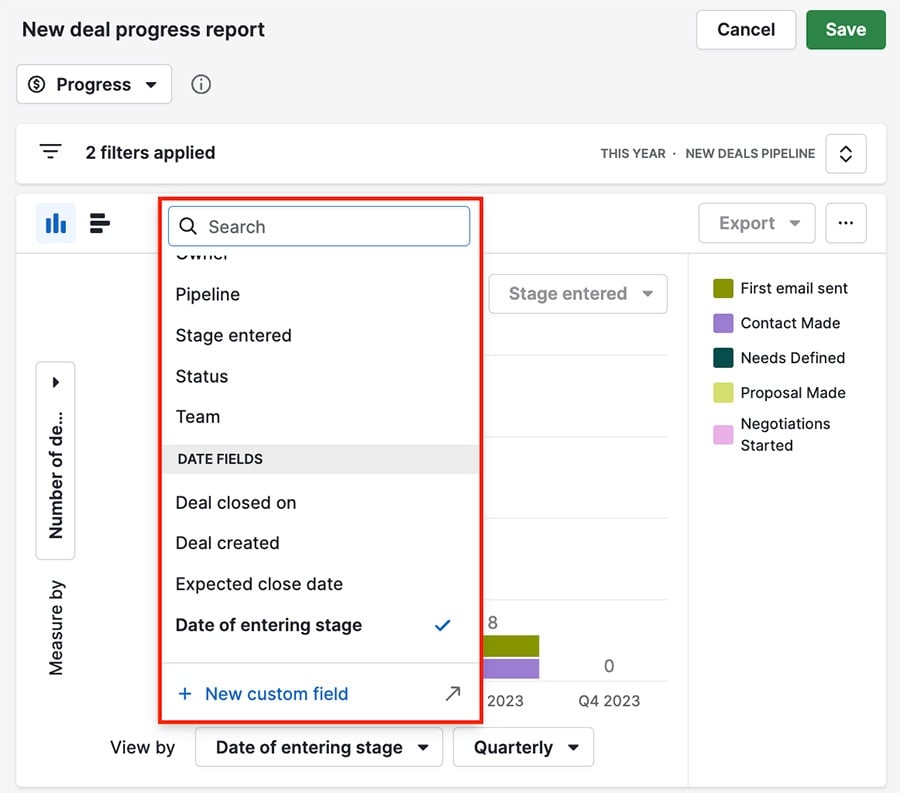
View by (x-axis)

The View by tab will allow you to group your data by a specific field in your Pipedrive account. You can group by various default Pipedrive fields as well as any custom fields of the following types:

  • User
  • Date
  • Single option
  • Multiple option
  • Organization
  • Person

Screen_Shot_2020-04-22_at_3.12.48_PM.png

Given that this report measures the progress through the pipeline, the Segment by filter will be locked into Stage entered to show the breakdown by stage. If you choose to view by Stage entered, no segment will be applied.

Once you've finished creating your activity report, you can add it to your dashboard or share it with your team.

Was this article helpful?

Yes

No

Related articles

Got any questions?

Contact us