Insights reports: emails performance
The emails performance report in Insights helps you track messages sent or received through email sync or Smart Bcc.
You can view key metrics like sent, received and opened emails, giving you insight into overall email volume and engagement.
Creating your emails performance report
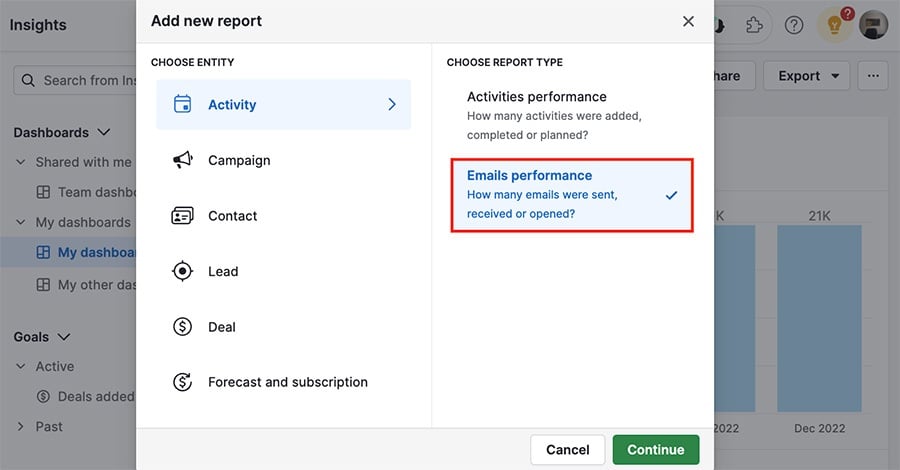
To create the report, go to Insights and click “+”> Report > Activity > Emails performance.
Viewing your emails performance report
Your emails performance report has three viewable sections: the filters, chart and table view.
Filters
At the top of your report, you can see your existing data filters and add new ones using ”+“ in the bottom left corner.
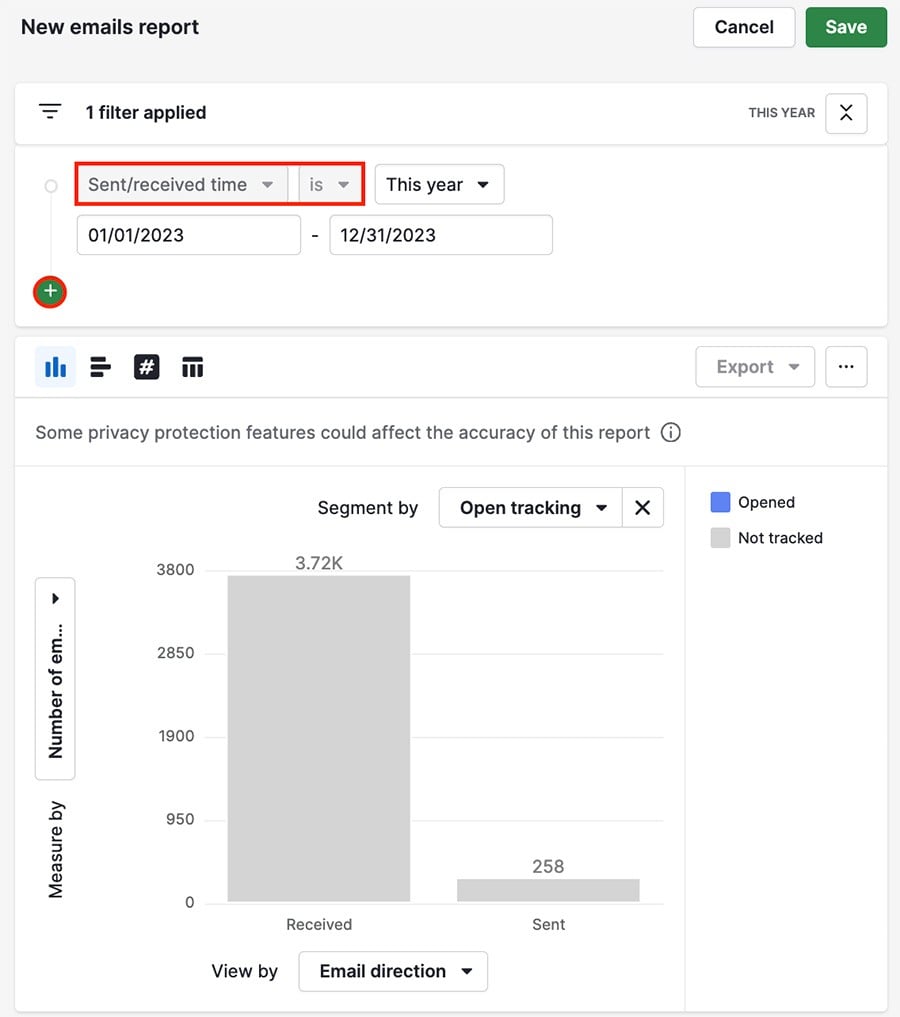
Chart
Below your filters is the chart section, where you can see a visual representation of your data.
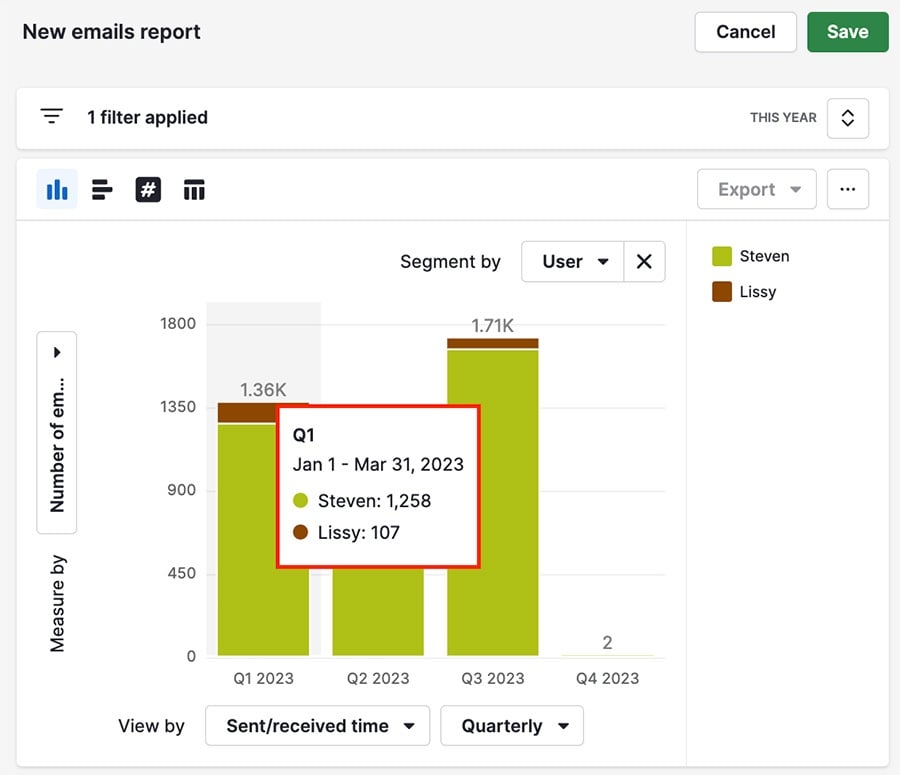
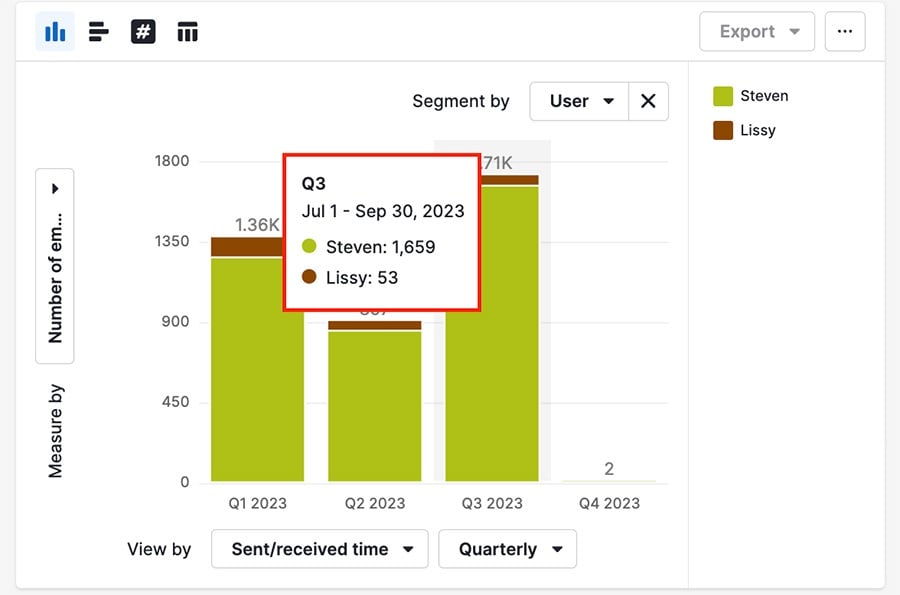
You can hover over any of the chart columns to see a breakdown of the data contained there.
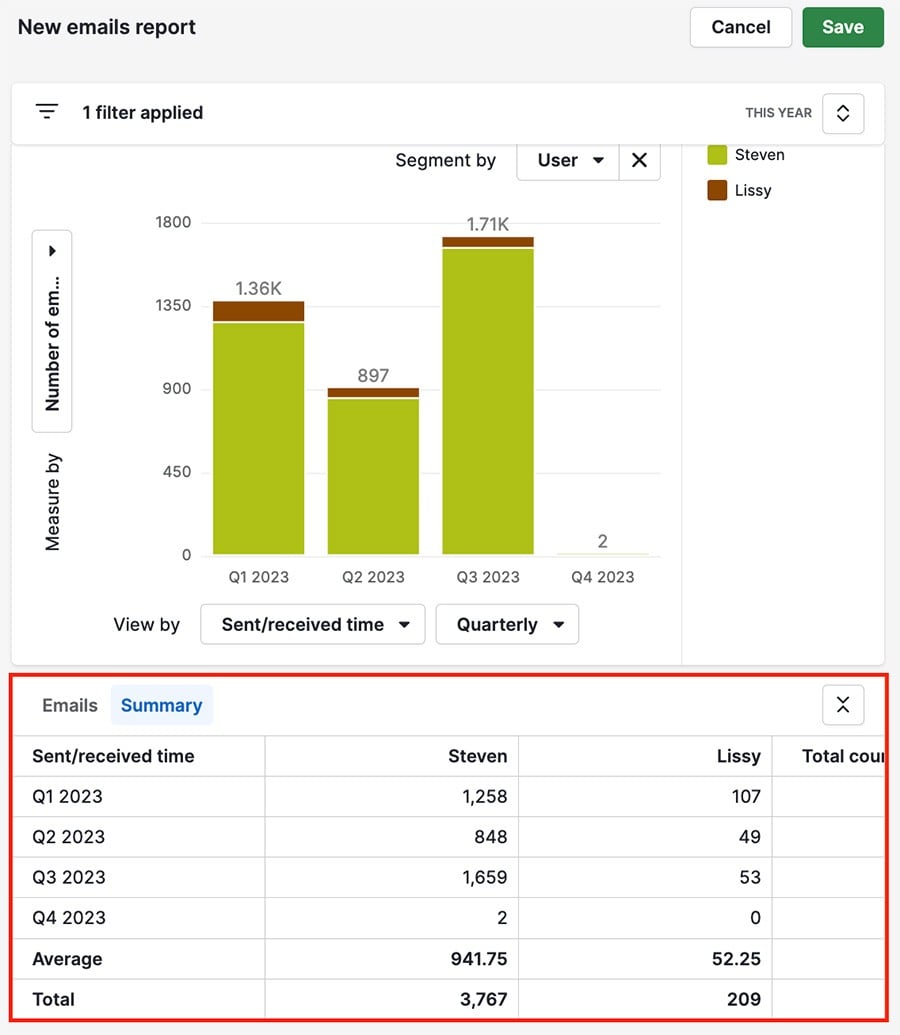
Table view
At the bottom of the page is the table view, where you can view your emails individually using a spreadsheet layout, or see a summary of the data contained in your report.
Customizing your emails performance report
Customizing your emails performance report gives you a multitude of options for visualizing your report’s data.
There are three metrics you can use to alter the appearance and data in your charts: view by, measure by and segment by.
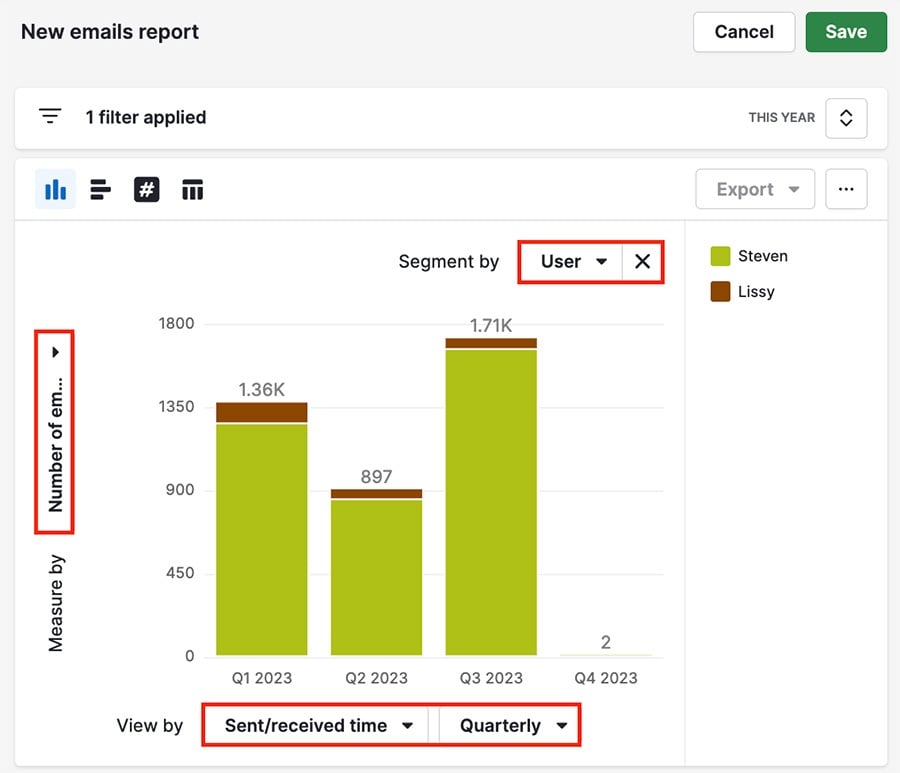
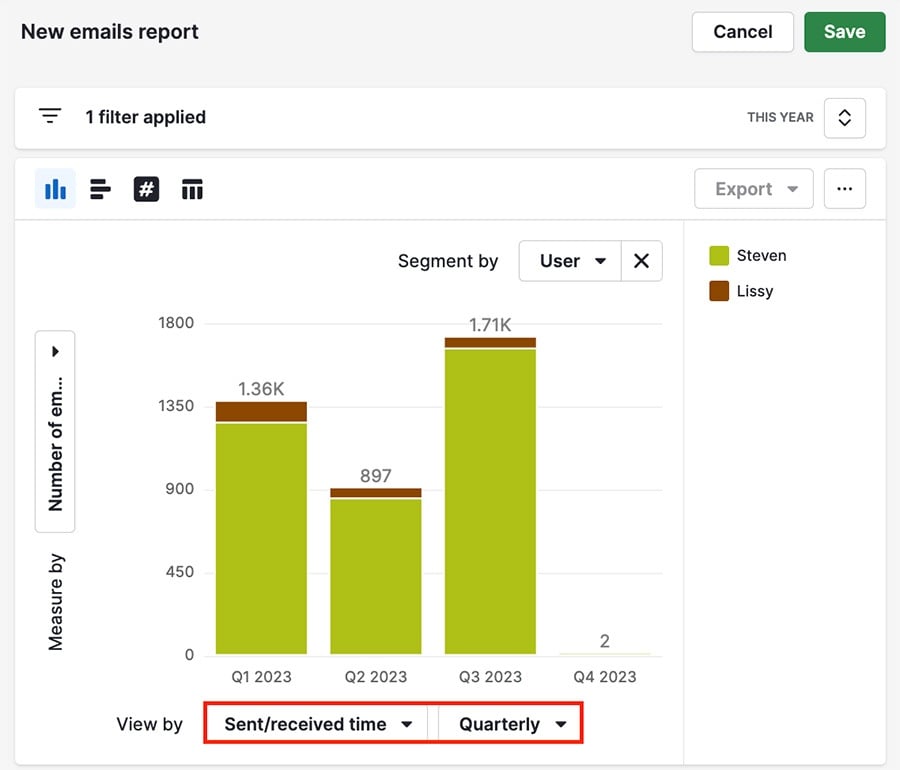
View by (X-axis)
The view by section dictates how your columns are separated in the chart. For example, this chart is divided into four sent/received time columns, one for each quarter in the year 2023.
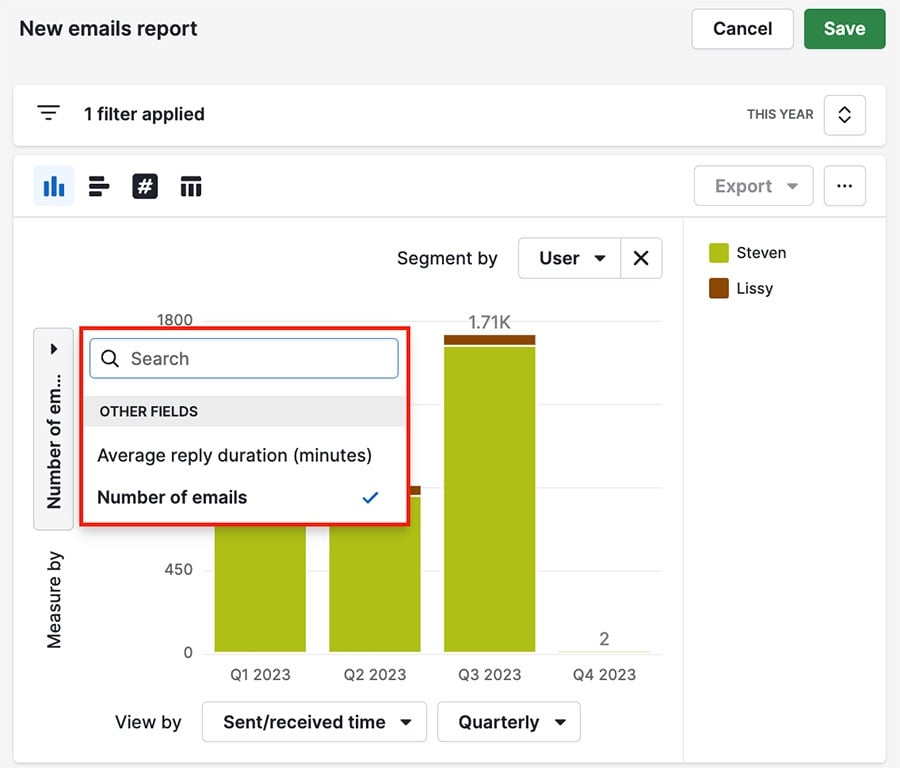
Measure by (y-axis)
The measure by section represents the data being counted vertically in each column. There are two available fields you can use for this:
- Average reply duration in minutes
- Number of emails
Segment by
The segment by section is represented by the coloration within each column. For example, in this chart the two colors (green and brown) show the emails sent by two different users.
There are six available fields you can use to segment your emails performance chart:
- Email direction
- Link tracking
- Open tracking
- Reply tracking
- Team
- User
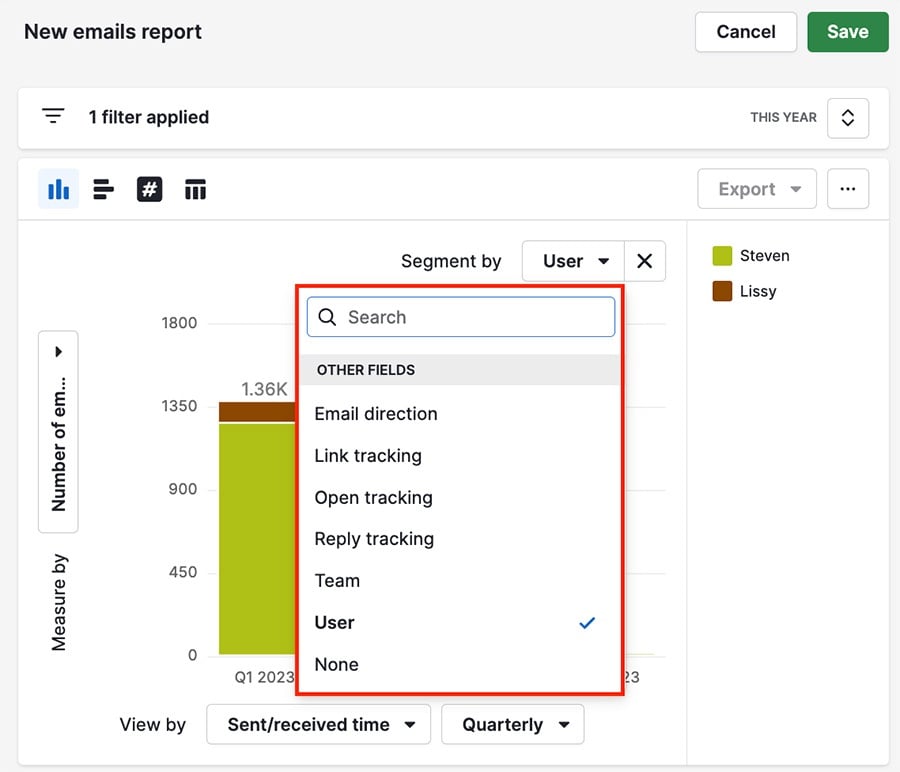
You can also choose ”none“ as your segment by option, in which case your columns will all appear the same color.
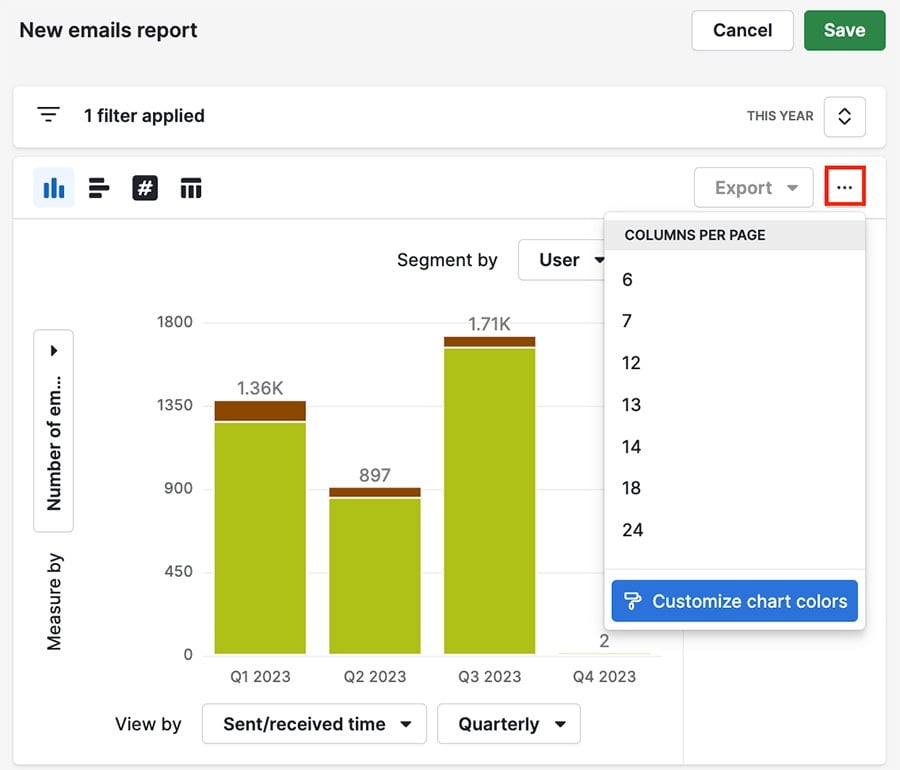
You can choose the color of your columns, as well as the number of columns displayed, by clicking the ”...“ in the top right corner of your chart.
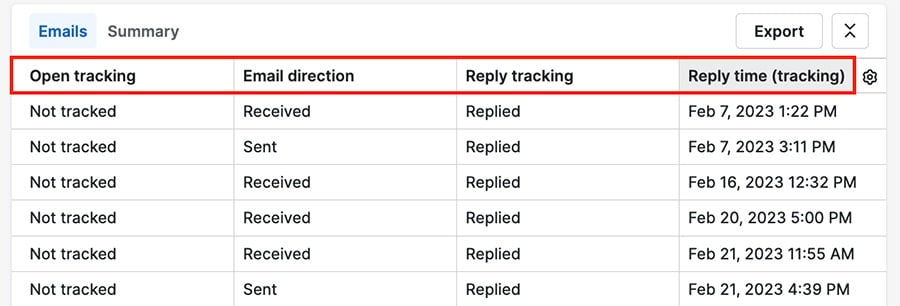
Reply tracking
You can use the reply tracking fields to see a variety of metrics like if or when emails were opened and replied to.
You can find reply tracking fields in the following locations:
Field name | Field location | Question answered by the field |
Reply tracking | Filter, segment, view by and table view sections | Did the recipient reply to my email? |
Reply time (tracking) | Filter, view by and table view sections | When did they reply to my email? |
Reply duration (minutes) | Filter, view by and table view sections | How long did it take after they received my email to reply? |
If you’re in the table view, you can click the gear icon to change the visible fields and see which ones are available.
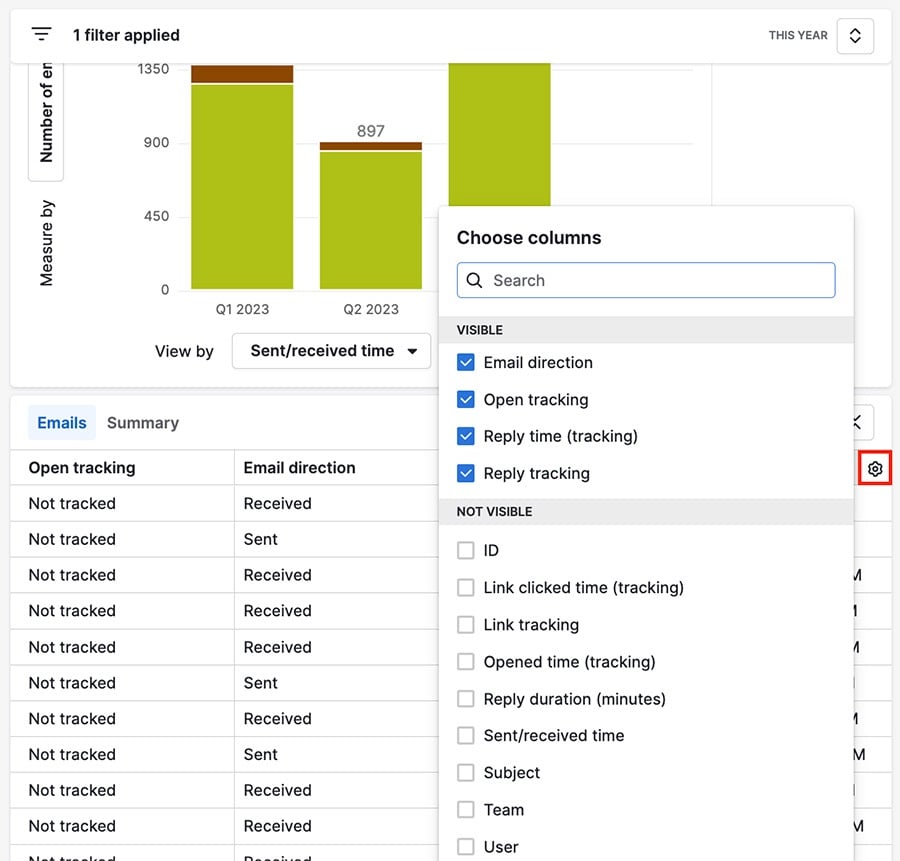
For example, in this chart the view by field is reply tracking, and the columns show emails that have and haven’t been replied to.
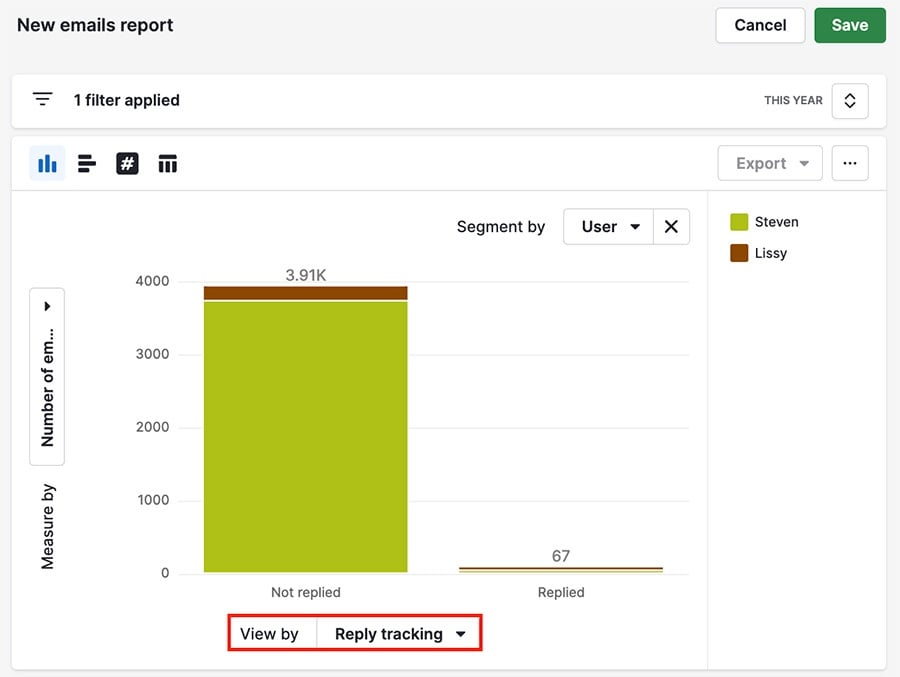
You can gather from this report that the majority of emails being sent out are not receiving replies. This information can be useful in deciding whether a different emailing strategy is necessary.
Was this article helpful?
Yes
No