Insights: reports, goals and dashboards
Keeping track of performance is an important part of managing sales, projects and customer relationships. Insights helps you understand what’s happening in your business by turning your data into reports, goals and dashboards.

What can I do in Insights
| Use Insights to... | Learn more |
|---|---|
| Analyze sales, lead, activity, campaign and project performance | Report types |
| Generate reports with AI | AI report generation |
| Visualize data with different chart types | Chart types |
| Track targets with goals | Goals |
| Organize reports and goals into dashboards | Dashboards |
| Customize report and goal colors | Color customization |
| Collaborate on dashboards with your team | Insights collaboration |
| Share dashboards with stakeholders | Shareable Insights |
| Export charts and table view for further analysis | Exporting from Insights |
| Monitor performance on mobile | Insights for mobile |
Analyze performance with reports
Reports help you understand trends, measure performance and identify opportunities across your sales process, projects, activities and campaigns.
What can I analyze
Insights supports reporting for the following items:
| Item | Examples |
|---|---|
| Activity | Performance and email reports |
| Campaign | Performance and conversion reports |
| Contact | People and organization reports |
| Lead | Performance and conversion reports |
| Deal | Performance, conversion, duration, progress and product reports |
| Revenue forecast | Deal and product forecasts |
| Project | Performance and duration reports |
Report availability depends on your subscription plan and enabled add-ons. For a complete list, see the report types article.
Create and customize reports
You can create reports manually or use AI report generation to build reports from natural language prompts.
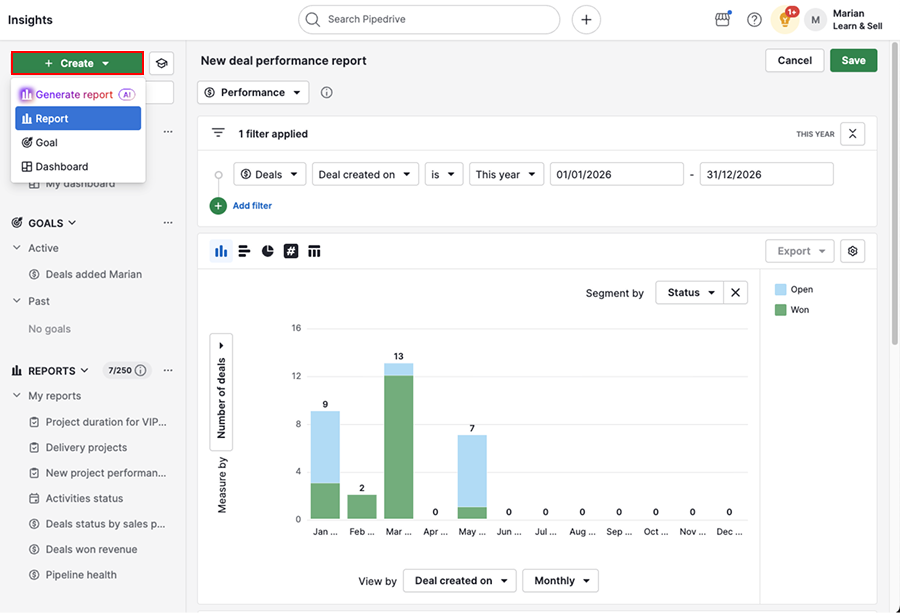
After creating a report, you can customize the data and visualization to focus on the information most relevant to your analysis.
Reports are organized into three sections:
| Section | Purpose |
|---|---|
| Filters | Define which data is included |
| Visual builder | Measure, group and visualize data |
| Table view | Review the items that match your filters |
You can use both default and custom fields in filters, the visual builder and table views.
Most field types are supported throughout Insights. However, date range, time and time range fields are currently available only in table views.
You can also combine data from linked items such as deals, leads, contacts, activities and projects to uncover relationships across your data and create more detailed analyses.
Track targets with goals
While reports help you analyze performance, goals help you measure progress toward individual, team or company targets over time.
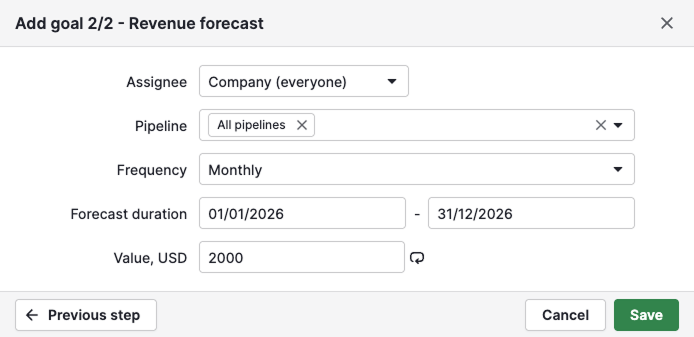
What can I track
| Entity | Goal target |
|---|---|
| Deal | Number or value of deals added, progressed or won |
| Activity | Number of activities added or completed |
| Forecast | Value of expected revenue |
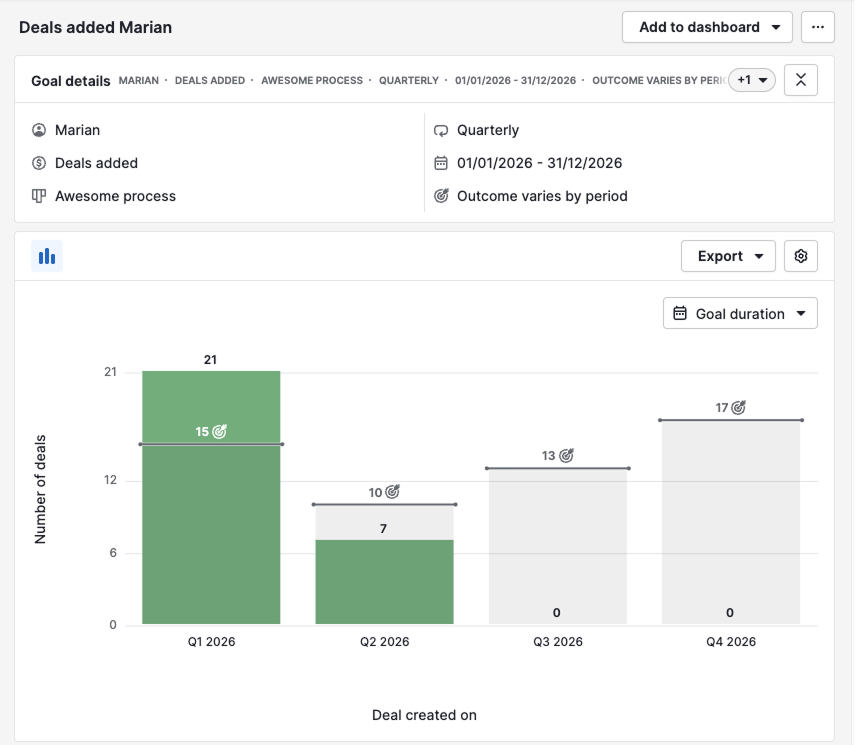
How goals work
Each goal tracks progress towards a target within a selected reporting period.
Monitor performance with dashboards
Dashboards bring reports and goals together in a single view, helping teams monitor performance and focus on the metrics that matter most.
Customize dashboards
Add reports and goals to dashboards to create a centralized view of your most important metrics.
You can then customize dashboard layouts by rearranging and resizing reports and goals.
Share and collaborate
You can share dashboards with other users in your company, create public view-only links for external stakeholders and collaborate on shared dashboards with your team.
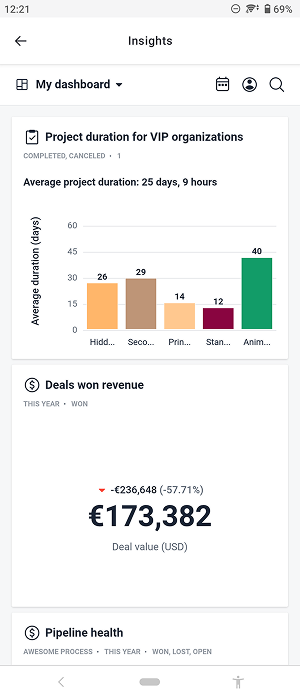
Use Insights on mobile
Use Insights on mobile to monitor dashboards and track performance while away from your desk.
Visibility and permissions
The data available in Insights depends on your visibility groups and permissions. Depending on your access level, you may see only your own data, data from other users or company-wide statistics.
For more information, see the Insights: visibility and permissions article.
Was this article helpful?
Yes
No