Insights: report types
Insights reports help you analyze performance, track trends and visualize data across your account.
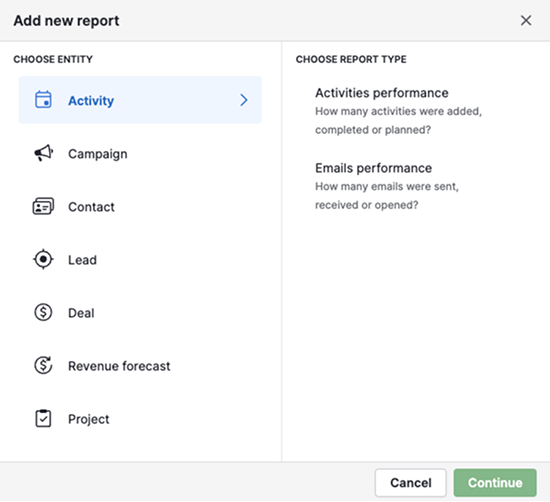
To create a report, go to Insights > “+ Create”> Report. The available report types depend on your plan and enabled add-ons.
Activity reports
Use activity reports to understand how your team communicates with customers and manages follow-ups.
| Report | Description |
|---|---|
| Activities performance | Analyze activity volume and outcomes to monitor productivity and team performance |
| Emails performance | Measures emails sent and received through email sync or Smart Bcc to track communication activity and customer engagement |
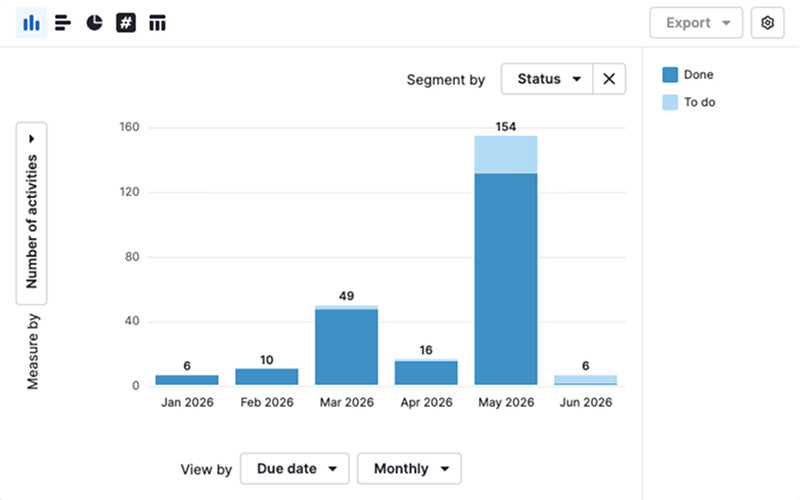
For example, the activities performance report can show which activities are completed or overdue based on their due dates.
Campaign reports
Use campaign reports to measure email campaign performance and understand how recipients engage with your communication.
| Report | Description |
|---|---|
| Campaign performance | Analyze delivery, engagement and tracking metrics to evaluate email campaign performance |
| Campaign conversion | Track recipient actions and conversion metrics to understand how campaigns contribute to business outcomes |
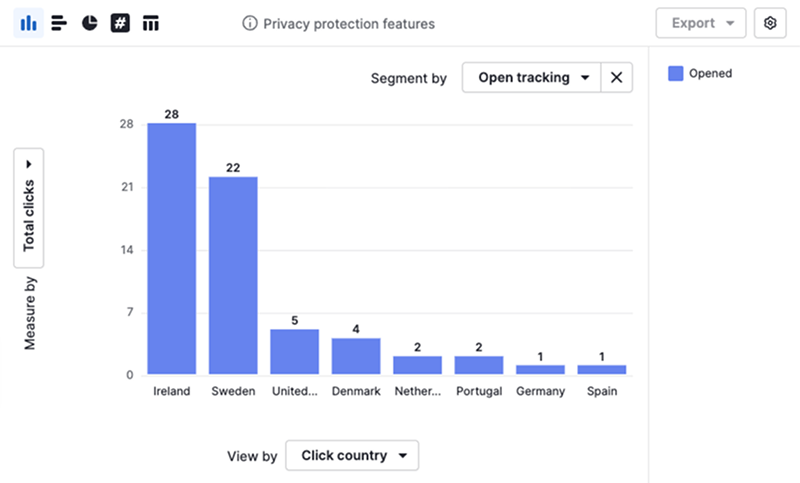
For example, the campaign performance report can compare engagement across countries to show where your campaigns perform best.
Contact reports
Use contact reports to analyze trends across your people and organization records.
| Report type | Description |
|---|---|
| People | Analyze contact details, ownership and custom fields to better understand and segment your customer base |
| Organizations | Analyze company information, ownership and custom fields to identify trends across organizations |
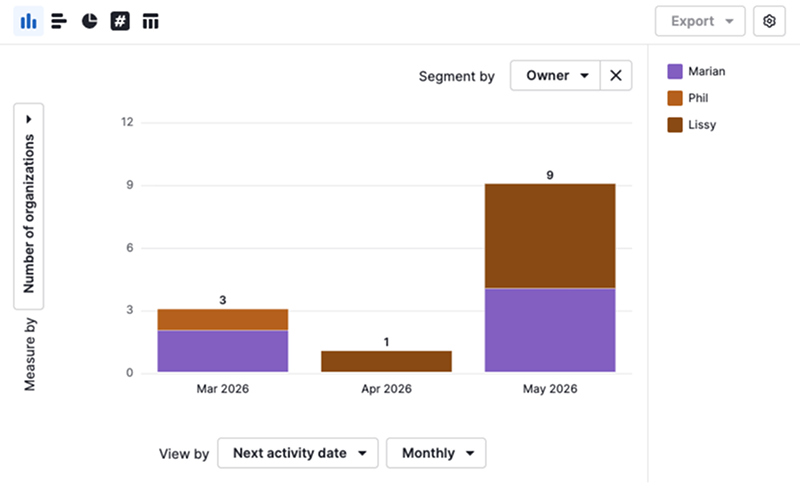
For example, an organization report can show which companies have upcoming activities scheduled.
Lead reports
Use lead reports to understand how leads are generated and how effectively they convert into deals.
| Report | Description |
|---|---|
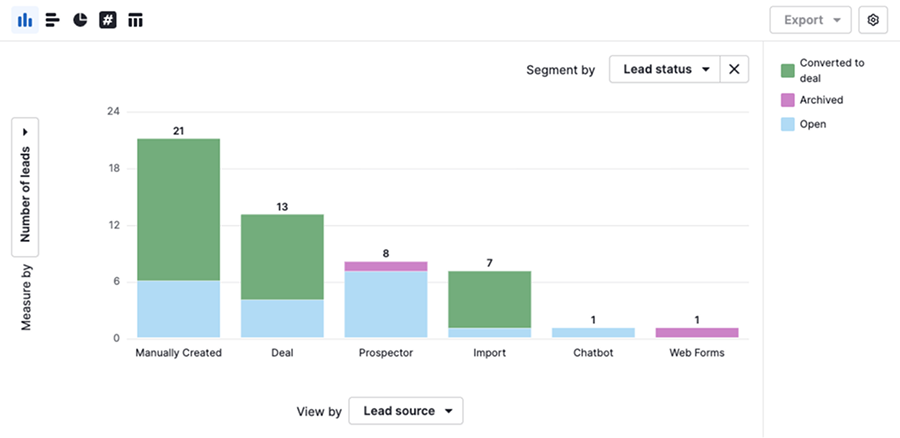
| Lead performance | Analyze leads by status, source, owner and custom fields to evaluate lead generation efforts |
| Lead conversion | Track lead-to-deal conversion rates and identify opportunities to improve qualification and follow-up processes |
For example, the lead performance report can compare lead sources to identify which channels generate the most leads.
Deal reports
Use deal reports to analyze pipeline performance, conversion rates, sales velocity and revenue trends.
| Report | Description |
|---|---|
| Deal performance | Analyze won, lost and open deals to track sales performance across your pipeline |
| Deal conversion | Analyze how deals move through your pipeline to understand conversion rates and identify opportunities for improvement |
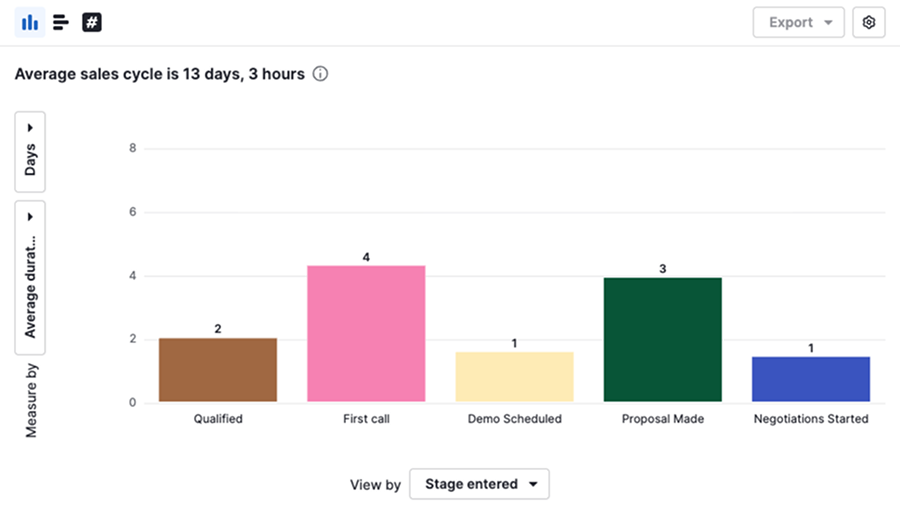
| Deal duration | Analyze how long deals spend in each stage to identify bottlenecks and slowdowns |
| Deal progress | Track deal movement through pipeline stages over time to monitor sales momentum |
| Deal products | Analyze products linked to deals to understand product performance and revenue contribution |
For example, the deal duration report can show how long deals spend in each stage of your sales cycle.
Revenue forecast
Use revenue forecast reports to estimate future revenue based on your deal and product data.
| Report | Description |
|---|---|
| Product revenue forecast | Forecast future revenue by analyzing products linked to deals |
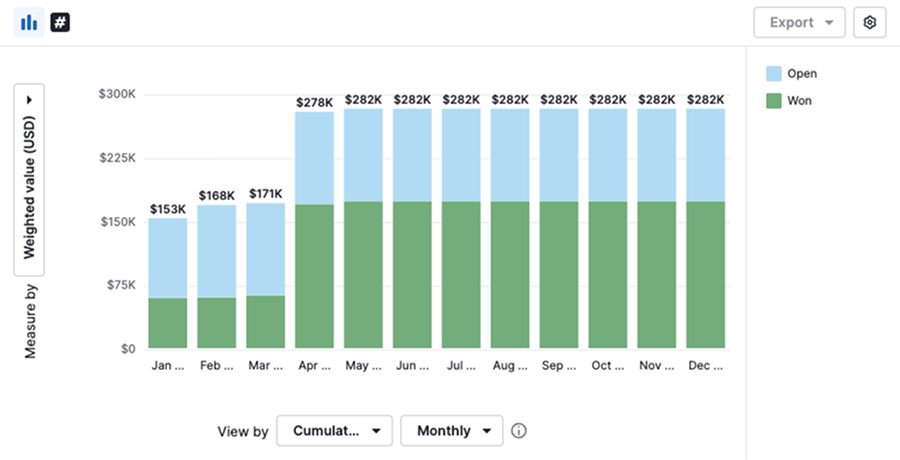
| Deal revenue forecast | Forecast future revenue based on deal values and expected close dates |
For example, the deal revenue forecast report can estimate expected revenue for upcoming periods based on your pipeline data.
Project reports
Use project reports to monitor project performance and understand project timelines.
| Report | Description |
|---|---|
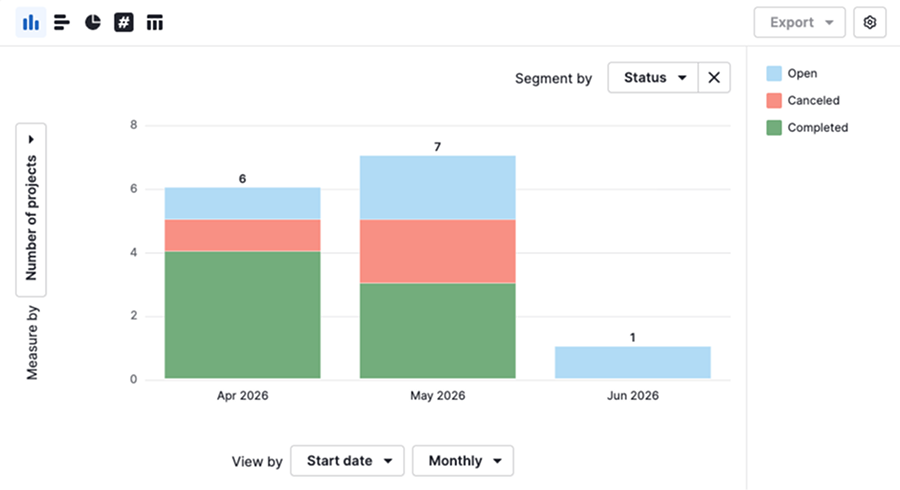
| Project performance | Analyze project performance to identify trends across teams, owners or project types |
| Project duration | Analyze how long projects spend in each phase to identify bottlenecks and improve planning |
For example, the project performance report can compare completed and ongoing projects to help identify work that still requires attention.
Was this article helpful?
Yes
No