Insights reports: project duration
The project duration report in Insights helps you understand how long projects take to complete and where time is spent throughout your project process.
Use this report to identify bottlenecks, spot delays and make more informed planning decisions. For example, you can use it to answer questions such as:
- How long does it take to complete a project on average?
- Which phases are slowing down delivery?
- Do certain teams or project types take longer to complete?
How project duration is calculated
The project duration report measures the time projects spend in each phase of the board.
When analyzing duration data, you can choose between two metrics:
Metric | Description |
|---|---|
Average duration | The total time projects spent in a phase divided by the number of projects |
Total duration | The total time projects spent in a phase |
Together, these metrics show both typical project timelines and the total time invested across your project process.
Create your project duration report
To create a project duration report, go to Insights and click “+ Create” > Report > Project > Duration.
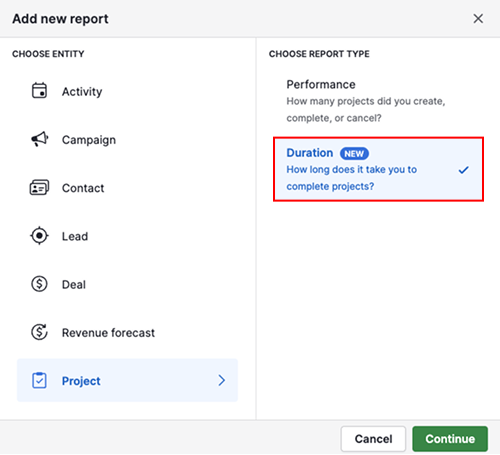
Click “Continue”.
View your project duration report
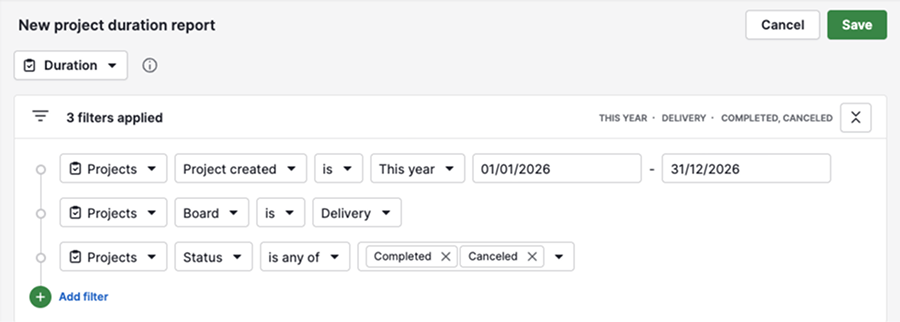
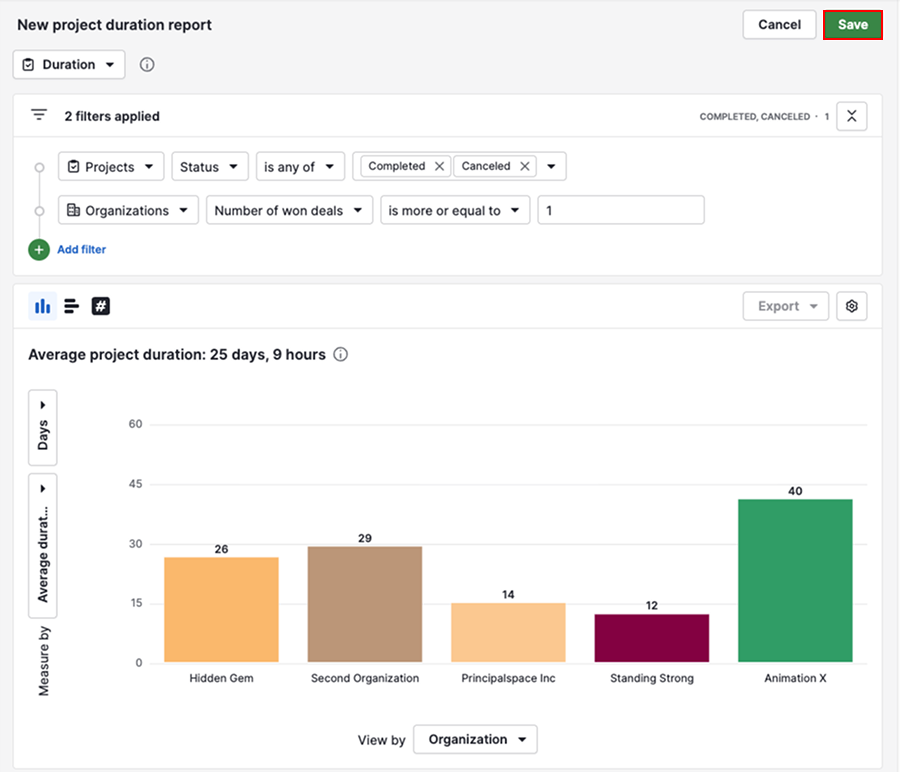
After you create the report, it opens with default settings. The report contains three sections: filters, the visual builder and the table view.
By default, the report displays completed and canceled projects from a specific board that were created during the current year.
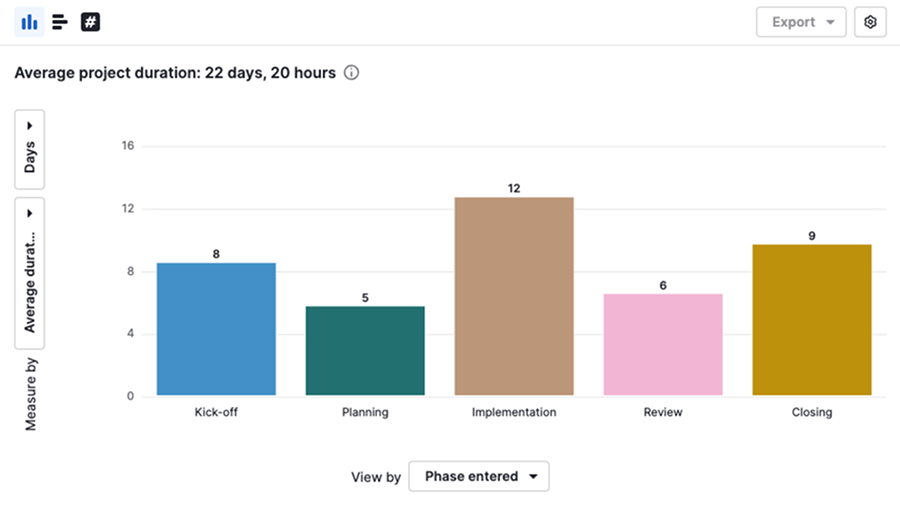
The visual builder displays a column chart showing the average duration, in days, spent in each project phase.
Click a column to view the projects included in that data point.
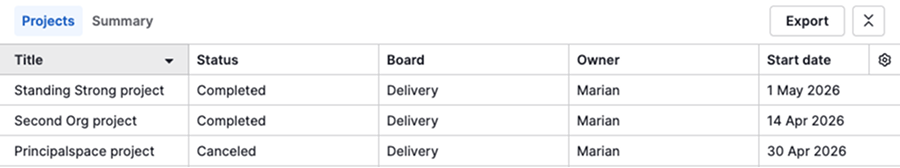
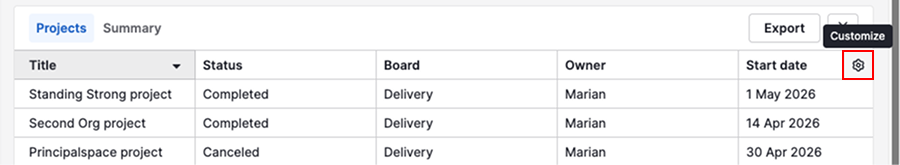
The table view displays all projects that match your current filters.
Edit your project duration report
You can customize the report to focus on the data that matters most to your team.
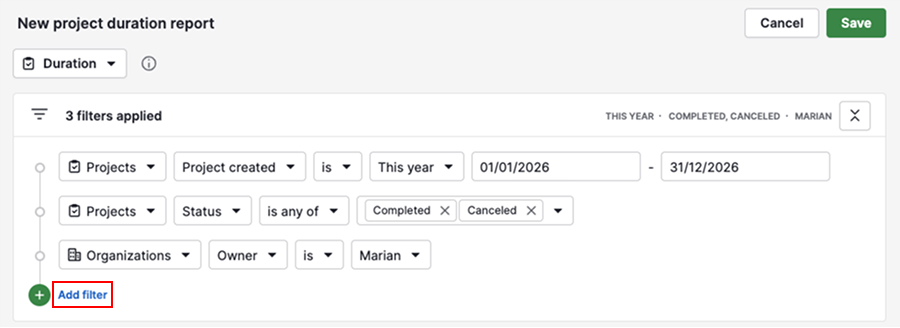
Adjust filters
Click “+ Add filter” to filter by projects, deals, people, organizations and activities.
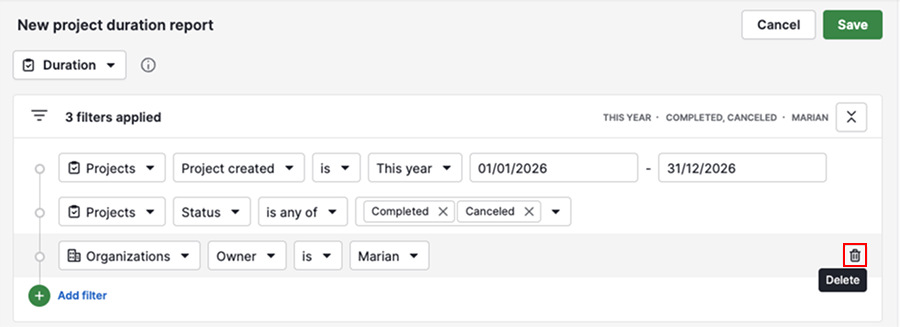
To delete a filter, hover over it and click the trash can icon.
Customize the visual builder
You can change how your data is displayed by selecting a column chart, bar chart or scorecard.

To adjust the number of columns per page or customize colors, click the gear icon.
Use the visual builder to choose the duration metric and grouping for your report.
Setting | Description |
|---|---|
Measure by | Select average or total duration. Display values in months, weeks, days, hours or minutes. |
View by | Group data by project or date fields to compare duration across categories and time periods |
Customize the table view
Click the gear icon to select the columns shown in the table.
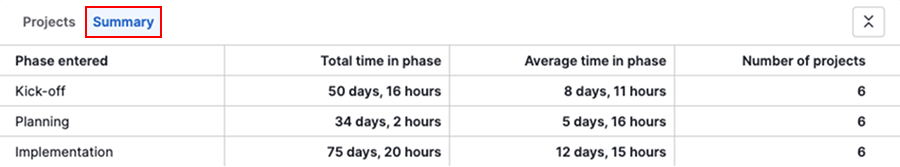
To view key metrics in a table format, switch to the summary tab.
Once you’ve finished customizing the report, click “Save” to keep your changes.
Share your project duration report
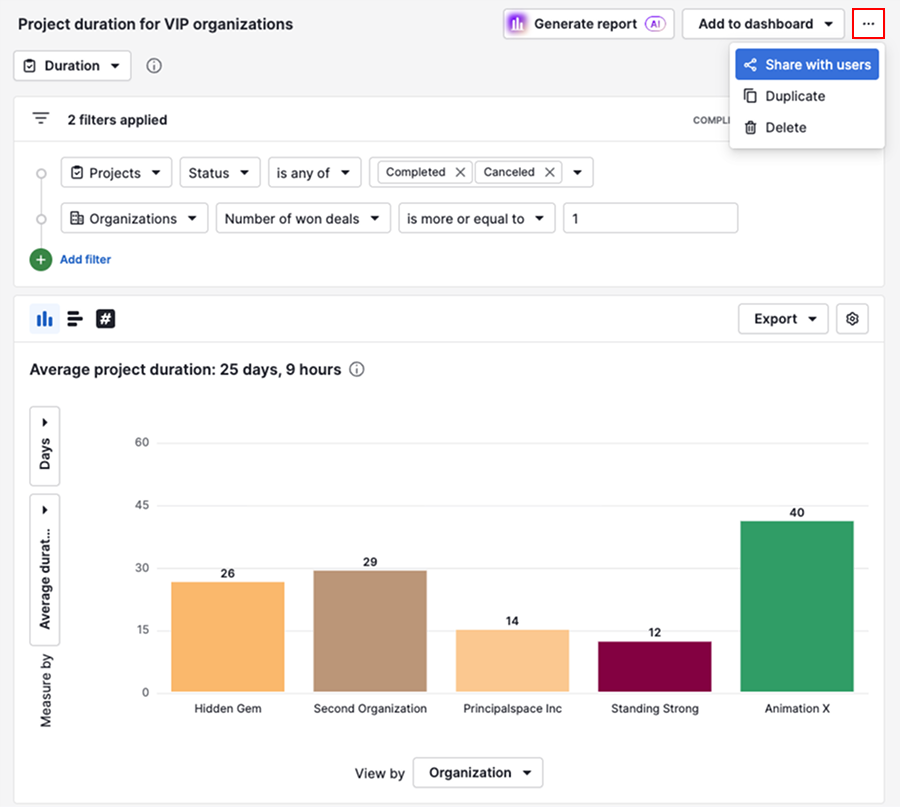
To share a report directly, click “...” > Share with users.
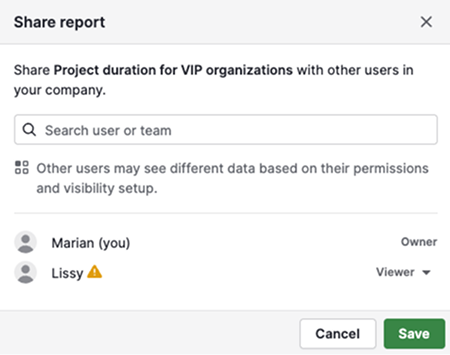
Select the users who should have access to the report.
To combine project duration data with other business metrics, add the report to a dashboard and share the dashboard with other users.
If you need to share the data outside Pipedrive, export it from Insights and distribute the exported file.
Was this article helpful?
Yes
No