Automation overview: monitor automation performance
The automation overview helps you quickly understand how your automations are performing.
Instead of reviewing executions one by one in the automation history, you can monitor automation health, identify failures and troubleshoot issues from one central place.
View your dashboard
To open the dashboard, go to Tools and apps > Automations > Overview from the account menu in the top right corner.
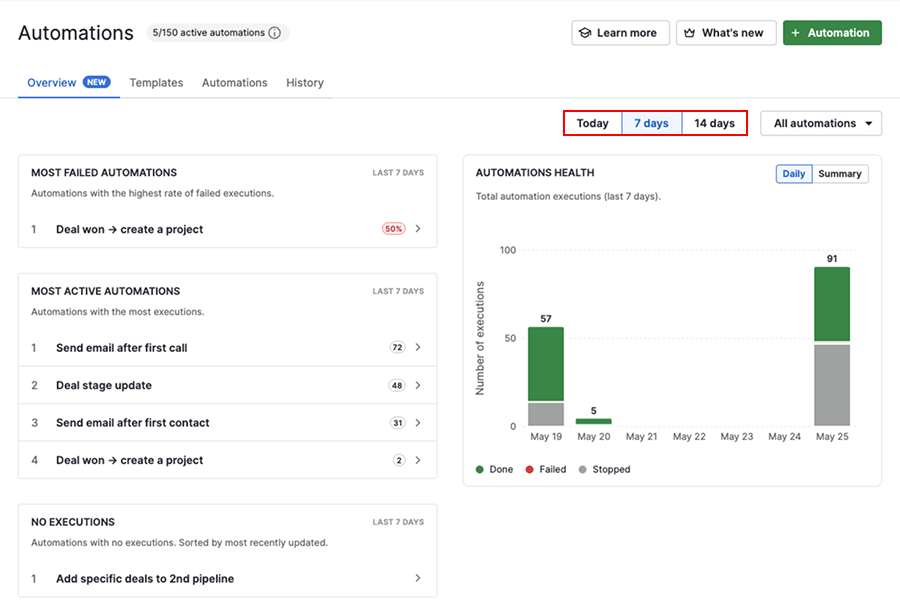
The dashboard lets you review automation activity for:
- Today
- Last 7 days
- Last 14 days
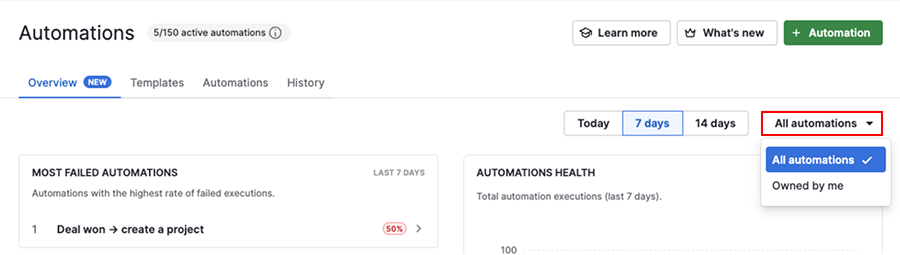
Users with global admin permissions can view automation activity across the entire company account or focus only on their own automations.
The dashboard includes sections that help you identify issues and monitor automation activity:
| Section | Purpose |
|---|---|
| Most failed automations | Review automations with recurring failures and identify issues faster |
| Most active automations | See which automations run most frequently |
| No executions | Identify automations that haven’t run during the selected time period |
| Automation health | Monitor execution status and automation trends over time |
How to use the dashboard
Fix failed automations
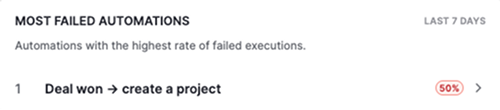
Use the “Most failed automations” section to quickly identify which automations need attention.
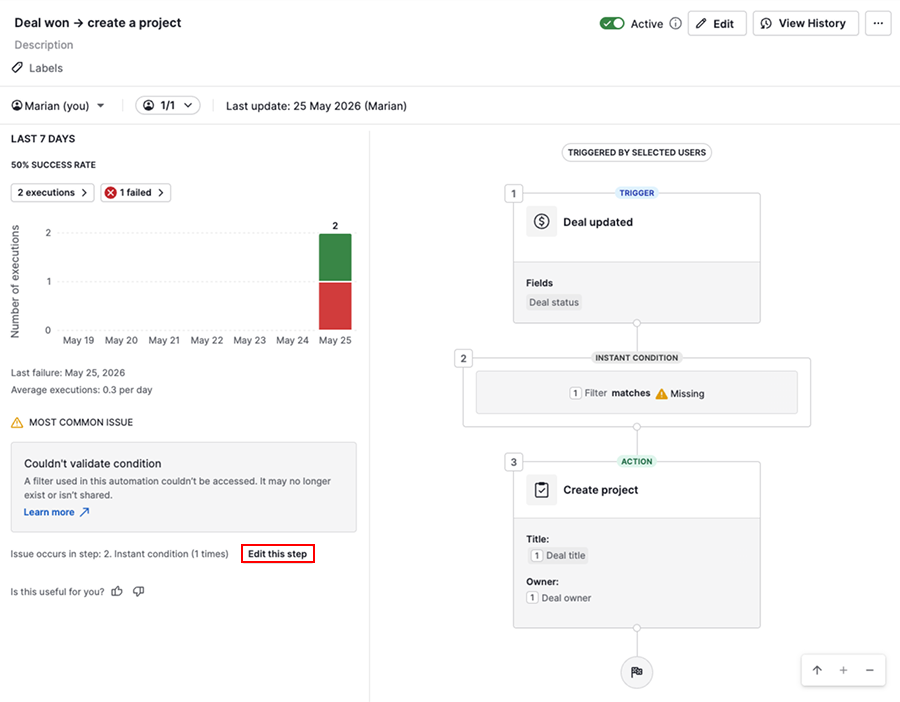
Click a failed execution to view details, including:
- When failures started
- How often failures occur
- The reason the automation is failing most often
You can also see which step is causing the issue and jump directly into editing the automation.
To learn more about common causes and solutions, check the troubleshooting automations article.
Focus on high-impact automations
The “Most active automations” section shows which automations run most frequently, helping you understand what drives activity in your account.
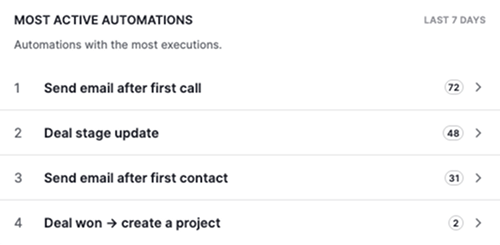
Use this section to confirm important automations are working as expected, identify automations that may be running more often than expected and prioritize improvements for the automations with the biggest impact.
Click an automation to review its setup, statistics and recent execution activity.
Keep your automations relevant
The “No executions” section highlights automations that didn’t run during the selected time frame.
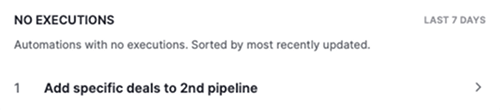
Automations with no executions can help you identify outdated setups or automations that are no longer being used.
This can indicate that the conditions are no longer met or that the automation needs to be updated.
Review these automations regularly to decide whether they still need to remain active or should be updated, deactivated or deleted. Cleaning up unused automations helps reduce clutter and makes automation management easier.
Track automation performance over time
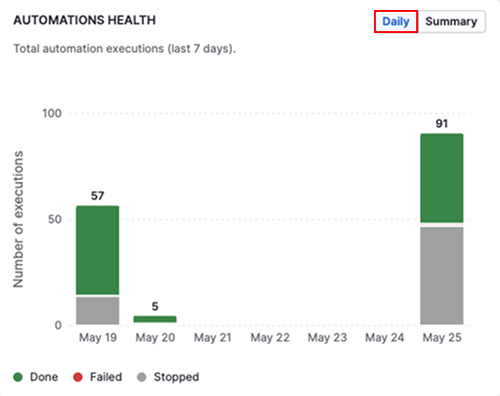
The “Automations health” section gives you a visual overview of how your automations are performing over time.
You can quickly see how executions are distributed across done, failed, pending or stopped, making it easier to spot patterns, such as increasing failures or delays.
Use the “Daily” view to identify when changes or failures started.
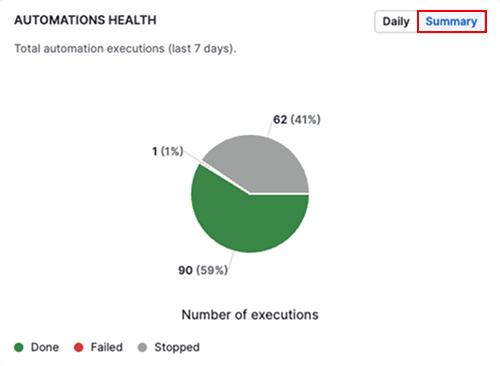
Click “Summary” to get a high-level performance overview of how executions are distributed across statuses.
Review these trends regularly to detect issues earlier, monitor the impact of fixes and keep your automations running smoothly.
Was this article helpful?
Yes
No